
David Rosenberg: 5 Indicators Show That We Are at a Cyclical Peak
- John Mauldin
- |
- March 29, 2018
- |
- Comments
BY JOHN MAULDIN
The FAANG stocks have ruled the technology sector the last few years and have had a heavy influence on the entire stock market.
Apple is the world’s most valuable company by market capitalization, with Amazon and Google not far behind. So anyone indexing US large-cap equities—which means almost anyone with investment capital—simply must own them.
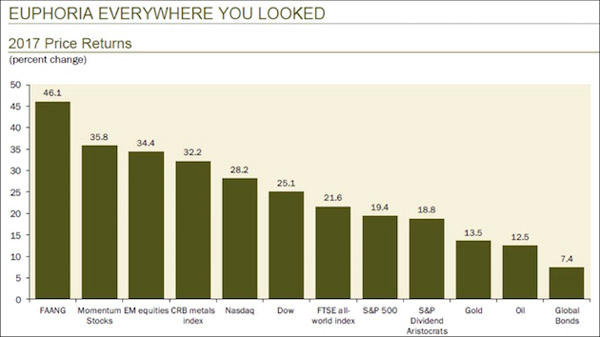
Here’s a chart that my good friend Dave Rosenberg of Gluskin Sheff shared at SIC 2018. It shows 2017 price returns for some selected asset classes. Last year, pretty much everything went up, but FAANG stocks did most.
Source: Gluskin Sheff
The FAANG stocks outperformed other stock benchmarks as well as gold’s price, oil, and bonds. And not just by a little. If you are an equity portfolio manager who didn’t own the FAANGs last year, you probably had some explaining to do.
But at SIC 2018, Dave went on to demonstrate why 2018 or 2019 could be quite different.
Extreme Overvaluation
Dave Rosenberg used four different S&P 500 valuation metrics:
- Forward Price to Earnings Ratio
- Price to Sales Ratio
- Price to Book Value Ratio
- Enterprise Value to EBITDA Ratio
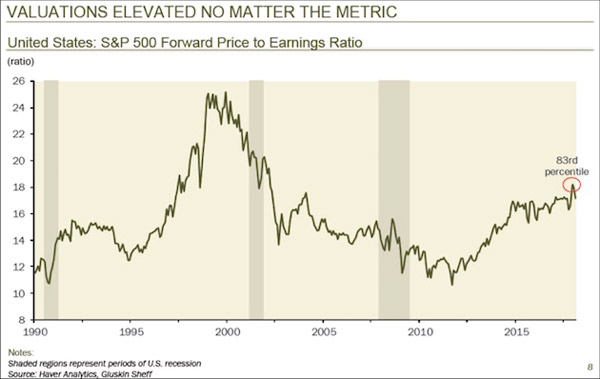
He then calculated the percentage of time that each of these had been at its present level or below. Here’s the result for P/E ratio.
Source: Gluskin Sheff
The S&P 500 forward P/E ratio has been below its present level 83% of the time since 1990. Repeating that exercise for the other three metrics and then averaging them, Dave found the index is presently at a 92nd percentile valuation event.
Here’s Dave, from the transcript, with my bold added:
In other words, only 8% of the time in the past has the stock market in the United States been as richly priced as it is today. And if you want to come up with reasons why that’s the case, that’s fine. But just understand that we are extremely pricey. We’re more than just a one standard deviation event versus the historical average.
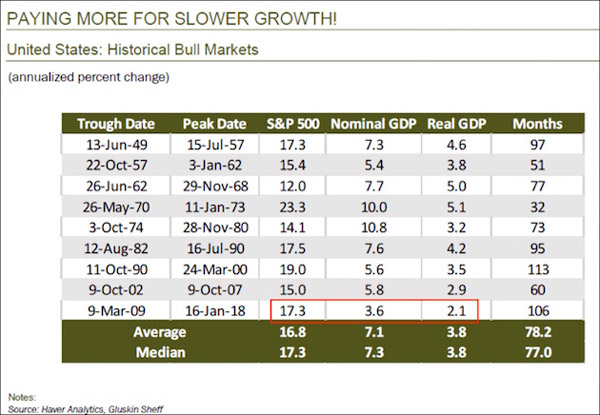
Dave then showed this surprising table, comparing historic bull markets with GDP change during the same period.
Source: Gluskin Sheff
The 2009–2018 bull market from trough to peak averaged 17.3% annually. Nominal GDP rose 3.6% annually during that time, and real GDP rose 2.1%. Go up the table to the 1982–1990 bull run. It reached a similar magnitude at 17.5%, but nominal GDP rose 7.6% and real GDP 4.2%.
Yes, GDP has its flaws. Today’s economy isn’t like the 1980s. Nonetheless, how is it that stocks rose the same amount on half as much economic growth? Dave said that if the stock-GDP ratio today had remained what it was back then, the S&P 500 would be around 1,550 today.
That’s how excessive valuations are now.
The Net Worth/Income Ratio at Pre-Crisis Levels
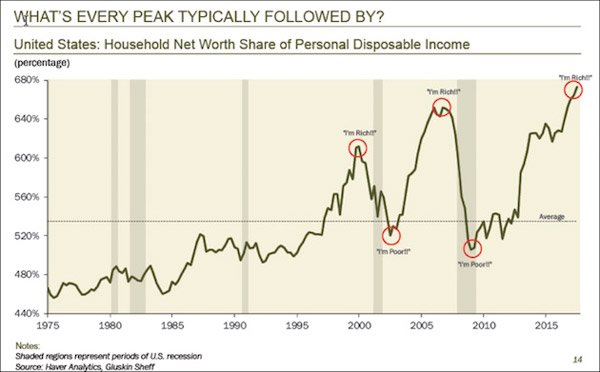
Here’s another way Dave looked at it: household net worth as a percentage of disposable income. The higher that ratio, the more wealthy and confident you probably feel if you are anywhere near average (and many aren’t, of course).
In 1999–2000 and again in 2006–2007, the ratio was near a peak, and people felt good. The good feelings didn’t last. Both times the ratio corrected back below its long-term average.
Source: Gluskin Sheff
And now? The net worth/income ratio is above where it was at those last two cyclical peaks. It could go even higher, too—but not by much, I suspect—and the move down probably won’t be fun.
Whenever it happens, the next downturn will be something new: the first socially networked recession and bear market. It’s hard to believe now, but Facebook and Twitter were both just infants in 2007. Smartphones were still a high-end luxury item, too.
We are now tied together in ways we were not back then. Those connections will make the experience quite different, so it’s worth talking about networks.
Get one of the world’s most widely read investment newsletters… free
Sharp macroeconomic analysis, big market calls, and shrewd predictions are all in a week’s work for visionary thinker and acclaimed financial expert John Mauldin. Since 2001, investors have turned to his Thoughts from the Frontline to be informed about what’s really going on in the economy. Join hundreds of thousands of readers, and get it free in your inbox every week.