
Sell in May and Go Away?
-
 John Mauldin
- |
- May 9, 2016
- |
- Comments
- |
- View PDF
 John Mauldin
Sell in May and Go Away?
Where Are We in the Cycle?
What Would Stan Do?
So What Do I Think?
Houston, Abu Dhabi, Raleigh, and SIC
The prevailing market lore is that one should sell in May and go away, returning in October. And over the last 65 years, that axiom has on average held true. Unfortunately, we can’t live on averages in the short term, and so we have to decide what to do today. Thus – just like the Fed – we are data-dependent.
This week’s letter is going to be short on words and long on data in the form of graphs and tables, and I will end up telling you what I think the average person should do about his or her equity portfolio. I realize that in writing to hundreds of thousands of readers, there is no such thing as one-size-fits-all, but at least I can point you in the right general direction. It will make for an interesting letter.
Before we dive into the data, let me offer this brief commercial note. My team at Mauldin Economics has persuaded Jared Dillian to offer his outstanding daily newsletter, The Daily Dirtnap, as a trial subscription for one week. I warn you, it can be a tad addicting, as Jared really does not seem to have a filter on his trading thoughts. He just lets it all hang out, and you get an “Honest to God I’ve got my own money on the line, and this is what I believe and how I’m investing” take on the market. You feel his pain when his trades go against him, and then you agonize with him as he decides whether to cut and run or stay the course. I have found The Daily Dirtnap to be a phenomenal educational tool for this sometimes-jaded analyst who reads everything. It’s fun, too.
You can opt-in right here to receive one free week (May 9th–13th) of Jared’s premium service aimed at sophisticated readers (and all of my readers are sophisticated readers) The price is right, so saddle up. And now let’s dig into some data.
“Sell in May and go away” is market wisdom that actually came from Britain, based on market patterns there. My friend Art Cashin has often noted that the financial market cycle is actually related to the agricultural cycle, when farmers had to borrow in spring but could then sell their crops in the fall. I would posit that we are no longer subject to the agricultural cycle; but, even so, the sell in May (buy in late October) cycle seems to have pertained for the past 20 years. Again, on average. You can see in the chart below from the Stock Trader’s Almanac (courtesy of my friend Jeff Hirsch) that since 1950 (the black line for those of you who are looking at color) average performance was essentially flat for the period between May 1 and November 1.
Jeff notes, by the way, that this advice still works in election years.
The green line is interesting. It shows the seasonal pattern for the years 1988–2015. For those 28 years, you would have done well to revise the market wisdom and sell on August 1, buy in mid-October. That said, the “ride” from May through mid-August has been rather bumpy. As in, fasten-your-seatbelt bumpy. Which may be another indication that the impact of the agricultural cycle on financial markets is fading.
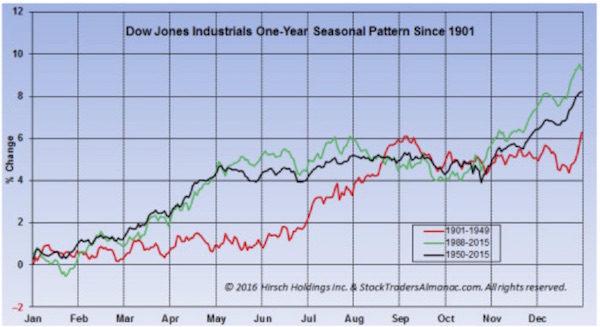
But any way you look at it, that nervous feeling you have about the market now is quite justified by the historical data.
On the other hand, I’m sure that my friend Barry Ritholtz and others of the bullish ilk (which technically I am, just more selectively so) can point to numerous years when “sell in May and go away” was really bad advice – as in you left a lot of money on the table by not being in the market. So what’s the point of timing if you can’t know how things will go from year to year? Well, let’s see what the data tells us.
First, let’s look at a chart courtesy of my friend Jeff Gundlach at DoubleLine, one which came to him from another friend, Jim Bianco. (It’s a small world, and we all “borrow” from each other. I do try to note whom I am lifting things from; and anyone can freely come to me and asked for a cup of sugar without having to worry if I’m going to ask for it back. It’s all just part of the pay-it-forward world in which we financial analysts live. The guys who are selfish and don’t freely share their sugar miss out on a lot of fun.)
Anyway, what Jim shows us is that early estimates of earnings have been falling dramatically in real time since 2012, which is another way of saying that analysts are wildly optimistic at the beginning of a forecasting period and get their asses kicked (that’s a technical economics term) by the end of it. Their records in 2015 and 2016 have been particularly embarrassing (or at least should have been).
Falling earnings – especially when they go negative, as they have for the last few quarters – are not typically associated with rising markets. Not that it can’t happen, but that’s not the way to bet the horse race. There was a reason that Majesto came off the line at 56-1 in yesterday’s Kentucky Derby while Nyquist was at 2-1. (Hat tip to short trader and horse aficionado Doug Kass, who called the Derby in advance and who also suggested that if Nyquist got past the Derby, he might be a good bet for the Triple Crown. Please note, gentle reader, this does not qualify as investment advice. Just a tip, is all.)
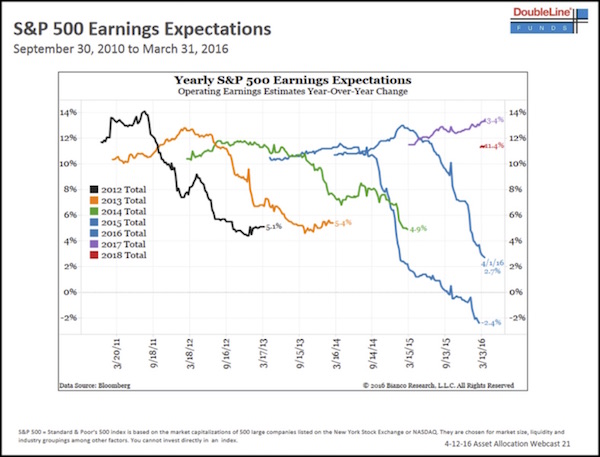
You can see the whole PowerPoint presentation from Jeff Gundlach here.
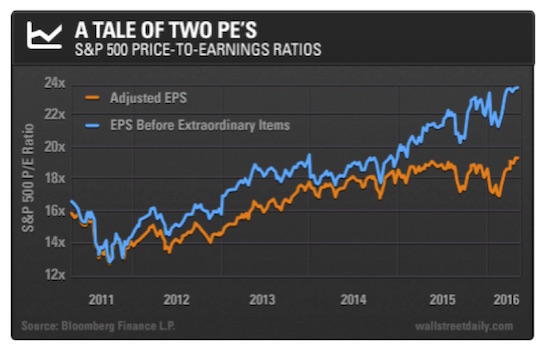
But price-to-earnings ratios, when quoted in the papers and or encountered in company reports, can be misleading. Companies highlight what is euphemistically called “adjusted earnings per share before extraordinary items.” The concept being that in the preceding quarter or year there were extraordinary expenses that are nonrecurring and will not happen again, so you shouldn’t hold them against the company’s actual earning power or future value.
Except that if you pay attention over the long term, these “extraordinary items” keep popping up every year, year after year after year. And amazingly, company financial officers manage to find more “extraordinary items” each year that they want investors to ignore. There is a significant difference between the P/E ratio when figured on adjusted (that is, more or less real) earnings, which in the trade we called EBITA, versus the earnings that I call EBBS – or more colloquially, “earnings before the BS we want you to ignore.”
Like what you’re reading?
Get this free newsletter in your inbox every Saturday! Read our privacy policy here.
The Wall Street Daily gives us the following handy little chart. It shows that for the past year or so we have had a local extreme between the two accounting methods. Guess which accounting methodology a reputable analyst and advisor is going to want you to look at? Seriously, if you don’t know the answer to that question, find yourself a qualified investment advisor and vow to never even think about managing your own portfolio again.
Last week we talked about the general decline in productivity over the last 50 years. And a drop in productivity is a precursor to a general decline in the growth of the economy. The following chart from Bureau of Labor Statistics data suggests that this year US worker efficiency (productivity) will show its worst back-to-back quarterly decline since 1993. That is not a good indicator of future rising profits.
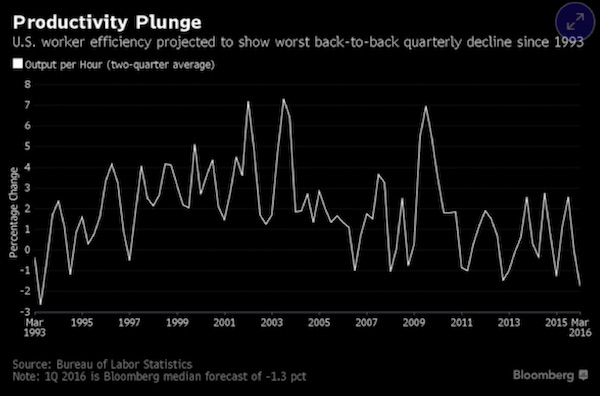
Here is the stark reality. Overall, profits in the economy cannot grow faster than the economy itself does. The profitability of individual companies can, of course, vary widely. Companies that are “hot,” that have a new cool toy and are taking market share, and that perhaps even have brilliant management, can see their earnings rise far above average GDP growth. But, taken as a whole, corporate profits are a function of GDP growth. And as I detailed last week, we are going to be lucky to see 1.5%, let alone 2%, growth for the next five years. That performance is basically all presaged by productivity and worker participation rates, both of which are ugly. And that’s not even taking into account that we are due for a recession within a year or so. Just saying…
So if you are in index investor and you think you are going to continue to get historically average returns, PLEASE take some time to review the fabulous data on the website of my friend Ed Easterling at Crestmont Research, and see what happens to people who want to get average returns. You should not even consider managing your own money until you have absorbed the free research on Ed’s site. At least then you’ll go about investing in today’s environment with your eyes wide open.
What you will see is that today’s price-to-earnings ratio is rather remarkably high. We are not at all-time highs like we were in 2008 or 1929, but if the S&P 500 or other similar indexes were a mountain you were climbing, you would need to be wearing an oxygen mask.
The table below is from Doug Short, as reproduced by Michael Lebowitz at 720 Global. Check out Michael’s report for a full explanation of the table. It’s very bearish.
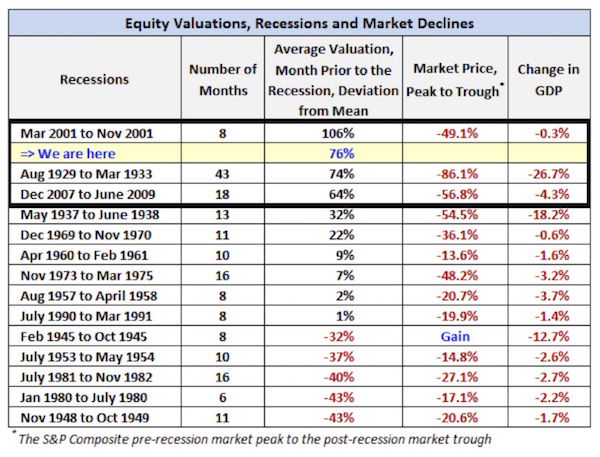
Says Michael:
The current P/E is 55% above the historical mean and surpasses 92% of all P/E data. Only multiples from the 2000 and 2008 bubble periods were higher than today. Doug Short created a simple model that averages four common equity valuation techniques. Based on his analysis, the market is 76% overvalued as compared to the average dating back to 1900. According to his analysis, current valuations are only surpassed by the exuberant markets leading into the depression of the 1930s and the tech crash of the early 2000s. Suggesting that equities are at lofty valuations and prices is not an overstatement….
The possibility of a recession while equity valuations are extreme is deeply troubling. Since 1929, there have been 14 recessions. All but one, in 1945, coincided with a period of negative returns for stocks. Included in this data, as shown in the table [above], are periods when stock valuations ranged from greatly undervalued to extremely overvalued. Data and Table courtesy Doug Short.
I went to Doug’s letter at Advisor Perspectives and read his commentary and decided that you should actually see the analysis of the four valuation techniques that Michael talked about. Below we have Doug’s average of Robert Shiller’s cyclically adjusted price-to-earnings ratio (CAPE), Ed Easterling’s Crestmont P/E, Nobel laureate James Tobin’s Q ratio, and Doug’s own monthly regression analysis of the S&P 500.
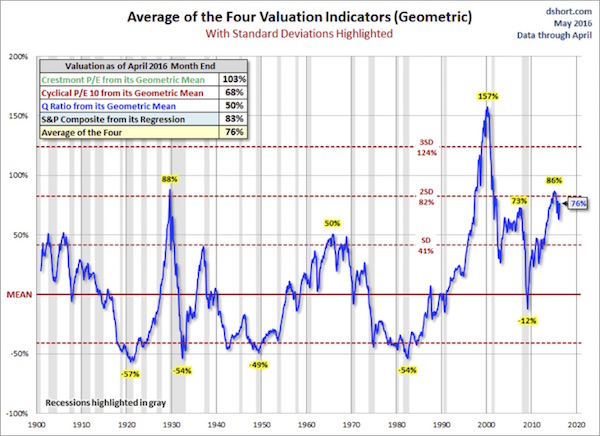
By almost any measure, we are at very high valuations. I’m not saying overvalued; I am saying very high. As in there is not a lot of room for valuations to go much higher without some serious growth and actual earnings. But as we saw from the data earlier, earnings estimates are chronically too high, and the prospect for future earnings is not reassuring.
This overall picture is not exactly encouraging if one wants to look past the summer into October.
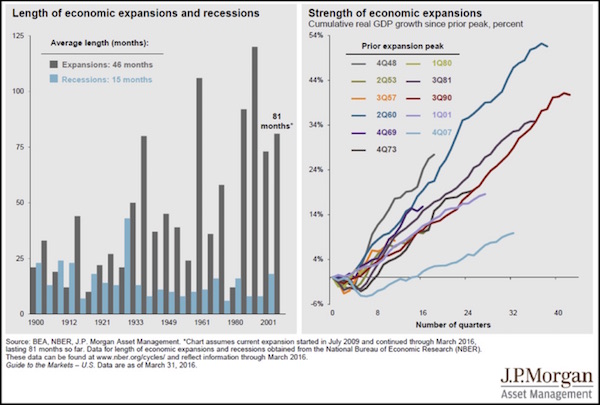
Next, let’s look at two charts from J.P. Morgan Asset Management. What they show is that we are rapidly approaching the third-longest expansion period of the past century. The graph to the left shows that we have been in the weakest recovery since World War II – which everybody knows. And the chart on the right shows that recoveries have been getting weaker over the years, with the current recovery the weakest by far. My personal opinion and my reading of the enormous body of research available is that this weakness is associated with the present massive debt of the US. If you look at the same data for Europe and Japan, you see the same trend.
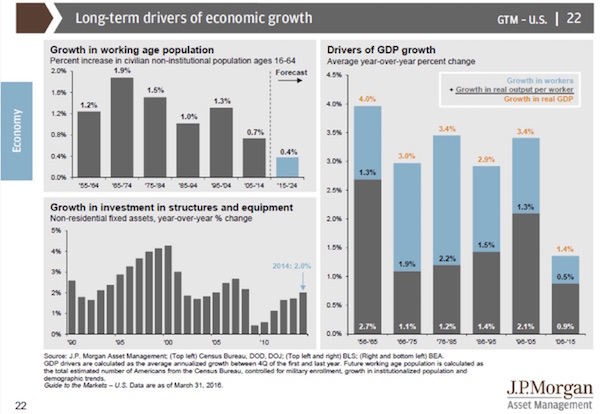
The chart below reiterates what I said last week: the long-term drivers of economic growth are increases in the working age population and productivity. In the chart, “growth in investment in structures and equipment” is substituted for productivity, which is just another way of looking at it. The results are the same: future economic growth is likely to be weak.
Finally, let’s look at a few charts from my longtime friend Steve Blumenthal’s letter, On My Radar. (Personal note: Steve and I are quite close. He is one of the nicest human beings I have ever met. He’s one of those guys you can trust with your wife and your life. I have watched him grow as a writer and analyst – and money manager – for almost 20 years now, and he makes me proud. Happily, he has no objection when I steal – I mean borrow – from him.)
Steve works closely with the noted firm of Ned Davis Research. I see their work from time to time, and I’m always impressed by it; but their work can be a little pricey, and they (justifiably) tend to keep their data close to their chest. So I am going to pull the following chart from Steve’s already-public letter of yesterday (http://www.cmgwealth.com/ri/radar-stan-says-sell/).
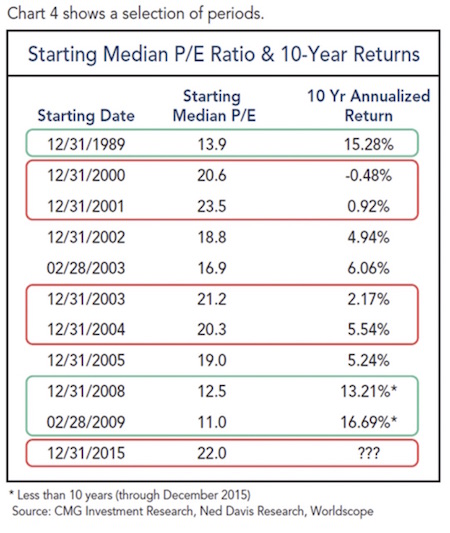
What sort of returns can we expect over the next 10 years? If you take the median P/E ratios of the last 16 years, as the chart above does, you see that follow-on 10-year returns don’t get your heart palpitating all that much. We are now at a starting median P/E ratio of 22, which, looking back over the last 16 years, suggests forward 10-year returns of 2% or lower. Ugh.
Like what you’re reading?
Get this free newsletter in your inbox every Saturday! Read our privacy policy here.
Let me quote from Steve’s letter for this next part:
Median P/E reached 22.7 at the end of April. That is higher than any point looking at median P/E data from 1964 to present with the exception of the crazed pre- and post-tech bubble period.
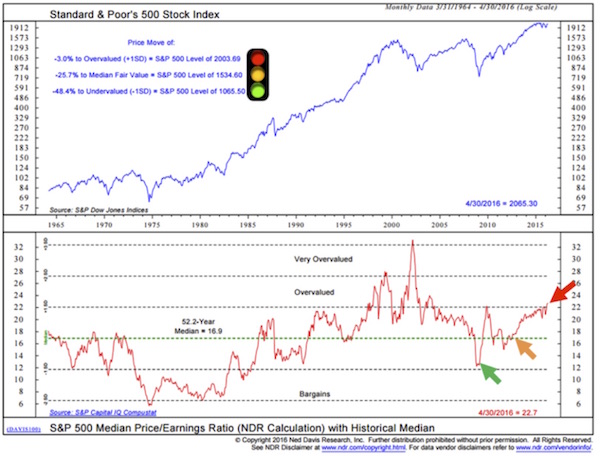
The next chart is courtesy of Ned Davis Research. The traffic light and arrows are my notations as I attempt to simplify the chart. What I like about this chart is that it does a good job estimating overvalued, fair value, and undervalued levels on the S&P 500 Index. Kind of an investor reality road map.
With the S&P 500 Index at 2065.30, it (by this measure) means that the market is overvalued by 3% (red light) by historical measures. In the chart, NDR uses a 1SD (standard deviation) move above fair value (it uses the 52.2 year median P/E of 16.9 to determine fair value) to identify the market as overvalued at 2003.69.
In English, a one standard deviation move is a movement away from a historical trend – it is something that doesn’t happen very often. In the case of median P/E, a 1SD move has happened about 10% of the time since 1964. Two SD moves happened about 2% of the time since 1964 (tech bubble). The point is they mark periods of extreme.
Fair value is determined to be 1534.60 (yellow light). Most of us would be happy with adding more to equities at that level, and we’d be ecstatic to get really aggressive should the S&P 500 correct to 1065.50 (the green light).
Again, this is saying that we are in the most expensive quintile or decile or however you want to measure it, in terms of historical valuation averages.
Possibly the most successful and legendary trader in the history of the world is Stan Druckenmiller. He and George Soros were partners for years, and Stan’s personal story is inspiring and a little bit intimidating. You simply cannot discount his sense of timing. There is an investment gathering (held earlier this week in New York) called the Sohn Investment Conference (run by investment guru Ira Sohn) that pulls together some of the greatest traders and hedge fund managers in the world every year. The concept is that you need to bring one idea to the table. Long, short, sideways – it doesn’t make any difference: what’s your best idea? The conference is widely attended and followed.
(I had a friend of mine take copious notes, which he allowed me to forward to my Over My Shoulder readers. OMS is where I post great third-party pieces that I think my readers need to pay attention to. It’s sort of like looking over my shoulder as I read – but only having to read the important stuff. The service is, in my humble opinion, justifiably popular. Click on the link above if you want to know more.)
Stan was his usual pull-no-punches self. Basically, Druckenmiller said, “Sell your equity holdings.” CNBC has a good summary:
“The conference wants a specific recommendation from me. I guess ‘Get out of the stock market’ isn’t clear enough,” said Druckenmiller from the conference stage in New York. Gold “remains our largest currency allocation.”
The billionaire investor expressed skepticism about the current investment environment due to Federal Reserve’s easy monetary policy and a slowing Chinese economy.
“The Fed has borrowed from future consumption more than ever before. It is the least data-dependent Fed in history. This is the longest deviation from historical norms in terms of Fed dovishness than I have ever seen in my career,” Druckenmiller said. “This kind of myopia causes reckless behavior.”
He believes U.S. corporations have not used debt in productive investments, but [have] instead relied on financial engineering with over $2 trillion in acquisitions and stock buybacks in the last year. This is finally showing up on the books of companies as operating cash flow growth in U.S. companies has gone negative year-over-year, while net debt as gone up, according to the investor.
Druckenmiller was negative on China’s economy going forward and believes recent attempts at further stimulus in the Asian country will not work and “aggravated the over-capacity in the economy…. Higher valuations, limits to further easing... the bull market is exhausting itself,” he said.
Not that you should pay any attention to me after reading what Stan thinks, but in a fit of hubris I will give you my personal two cents. Please note, the following does not constitute financial advice. For that you need to consult your financial advisor, unless of course, you are a financial advisor, in which case you need all the help you can get at this point to figure out what you’re going to do for your clients.
True bear markets, the ones that cause gut-wrenching pain and take years to recover from, are always and everywhere associated with recessions. In contrast, the 1987 crash, 1994, 1998, etc., all showed relatively quick recoveries. Those are extremely difficult to time.
I look at the grand global macroeconomic scheme, and I find making a recession call to be very difficult. Slow growth? Absolutely. But that is different from a recession. Could we see a recession (as none other than Donald Trump has suggested) in the near future? Maybe. There is always another recession. And I sincerely think we will have a recession within the next two years, simply because the current recovery is so long in the tooth and near exhaustion, not to mention the exogenous shocks that could come from Europe and China.
And that brings me to a story (doesn’t it always?). In late 2006, I was on The Larry Kudlow Show with Nouriel Roubini and John Rutherford. Larry and John were aggressively bullish, and Nouriel and I were arguing that there was a recession and hence a bear market in equities coming.
Technically, I was right. A recession started in 2007 along with the collapsing bear market. But my timing was a tad off. That is, if by “a tad” you mean six months. Because for the next six months the market proceeded to rocket up another 20%. This was October, and evidently the “buy in October” crowd was operating at full throttle. However, I wasn’t making a market timing call; I was simply pointing that the negative yield curve was shouting at us that there would be a recession in the coming year. As in screaming, double exclamation points, at the top of its throat shouting.
So, noting that my timing is not particularly adept, let me offer the following thoughts.
Sell in May and go away has on average been good advice. Given that we have very high valuations in early May, I think it is appropriate to adjust your portfolio. Also, given that we don’t know if we’re going into a recession (a development that would cause you to go completely negative or even short), I think it makes sense to just make your portfolio “neutral.”
In essence, make your equity portfolio in general neutral and then poke your head up again in late September or early October and look around at the macro situation.
Like what you’re reading?
Get this free newsletter in your inbox every Saturday! Read our privacy policy here.
This is a general market call and not a specific equity call. The bulk of my personal portfolio is in funds that have the ability to go long or short. I trust their management to figure out what to do. I am pretty well diversified in that portfolio. I can tell you right now that some of those funds are going to knock the ball out of the park and some are going to be more than a little disappointing. The problem is that I can’t tell you which ones will go which way in advance. But they all have the potential for making money in a sideways and/or down market.
That said, I do own a few stocks that I am not going to hedge and that I have no intention of selling. These are specific companies that I would tell you to buy today (if it were legally possible for me to do so), even in the face of all the information above. I am a long-term investor, and I think the prospects for these firms are very good.
So, when you look at your portfolio, you have to ask yourself, would I be happy if my equities were down 20 or 30%? There is a difference between an index fund and specific equities. I look at an index fund as a place to park money and perhaps do a little trading, not as an investment. The equities I do own are those that I fundamentally believe will be far more successful than the general market will be. I will admit that I don’t own many such stocks, but I believe in the ones that I do own. Other than those stocks, I generally let other managers do my investing for me. Yes, I do the occasional trade when I see something just stupid crazy, but in general I do my homework on managers and not equities. Doug Kass tells me to short Apple, by the by, but I don’t necessarily agree on that one.
And that brings me to my last point. I am not telling you to short the market here. Shorting is for professionals and big boys. People who decide they want to short the market can get their private parts handed to them faster doing that than any way I know. I know a lot of professionals who make a good living shorting various stocks; but none of them bet the farm, and all of the successful ones have systems that tell them when to cover their trades.
To summarize, the data suggests to me that the upside just isn’t there for being in the market from May through September. Again, the market could rip 20% to the upside, and you’d come back and tell me I was an idiot.
However, given the high valuations and the historical lack of performance in the May through October period, I think that going neutral makes a lot of sense now.
How do you do that? Well, it’s a little tricky. If you have an advisor (and 97% of you should), go to him or her and ask about the wisdom of going neutral. I get that there are special situations (like those I mentioned above) and that you also have tax considerations. Selling a stock with a 100% gain just to give Uncle Sam a chunk is painful. But there are ways to neutralize the downside in your portfolio. This of course means that you have foregone any upside, but we all have to make a decision.
Your decision today is what you should do with your portfolio over the next few days. In fact, that is what your decision should be every day. You should look at your portfolio and say, do I want to own that stock today? Would I buy it at today’s price? Honestly, if you don’t reevaluate your portfolio regularly, then you should get somebody to do it for you. Pay a reasonable fee and go back to doing what you really want to be doing. Bottom line: somebody should always be paying attention to your investment portfolio. You worked too hard to accumulate that portfolio to ignore it.
Houston, Abu Dhabi, Raleigh, and SIC
This coming week I fly down to Houston to speak at the S&P Dow Jones Art of Indexing conference. I will fly to Abu Dhabi next weekend for the next in a series of meetings and speaking engagements. I was surprised to learn that I can fly nonstop from Dallas to Abu Dhabi on Etihad Airways. That’s one of the nice things about being in Dallas – there are very few places in the world I can’t get to either directly or with one layover. I will let you know about my experience on Etihad.
I then come home and almost immediately go to Raleigh, North Carolina, to speak at the Investment Institute’s Spring 2016 Event. I’m looking forward to hearing John Burbank and Mark Yusko (who will also be at my own conference the same week) and then to being on a panel with them.
Afterward, I make a mad dash for the airport, arrive back in the Dallas late Monday night, and make final preparations for my Strategic Investment Conference, where upwards of 700 of my closest friends will gather to discuss all things macroeconomic and geopolitical. It is going to be a great week! If you won’t be going to the conference, you can have the next best thing: recordings of the speakers, delivered just a few days after SIC 2016 ends. You can order your set here. I should note that the price will go up after the conference. A lot. So just jump on this offer now.
I had thought about offering comments on the new presumptive presidential nominee for the Republican Party, Donald Trump. I was privileged to talk privately with Peggy Noonan this week, after which I listened to her speak, partly on what is clearly a major shakeup of the Republican as well as the Democratic Party. Then I had a conversation with my friend Neil Howe, historian and generational demographer, which provoked some even deeper thinking about the current generational shift.
For the first time since Reagan (and before him Goldwater, in the early ’60s), we are seeing a significant political shift, and it is part and parcel of what Peggy Noonan calls “the uprising of the unprotected” and what Neil Howe thinks of as a clear generational shift that you see towards the end of what he calls “the Fourth Turning,” as it evolves into the next “First Turning.” This is a phenomenon happening all over the world, and it is going to occasion a lot of research and conversation.
So, given the fundamental nature of the change we’re undergoing, I’ve decided that I’m not going to treat you to a shoot-from-the-hip analysis of the political scene. I will say this. The people who told you last year that Donald Trump couldn’t win (which would have included me) have simply not recognized the generational shift that is underway. If somebody were to call me “establishment,” I would laugh. I am the last person that I think of as establishment. That would be like calling me gay because I have gay friends. And I admit to having a lot of establishment friends. However, in sober reflection, I see that I may have picked up a bit of their thinking.
I was judging this year’s coming election on past performance. What do I keep telling you about your investments? Past performance is not indicative of future results. But I let that rear-view-mirror frame of mind instruct me as to future political results.
Like what you’re reading?
Get this free newsletter in your inbox every Saturday! Read our privacy policy here.
Just as the macroeconomic picture can fundamentally change, which then shifts the investment returns that a generation can expect, the macro-political (if I can coin a word) environment is subject to massive tectonic shifts. And when I look at the causes of the current shift, I don’t think it’s a temporary one. And while its root cause may be more generational and demographic than it is economic or geopolitical, I think we can lay some of the blame at the feet of our central bankers. They have so shifted the economic environment that more and more people feel left out and betrayed by the system.
When we see that a majority on both the left and the right are voting for people who would fundamentally disrupt the system, we should understand that a powerful shift in the public mindset is underway. And that means we could be looking at radical adjustments not just in political scenarios but also in our economic scenario – a matter that bears serious thought.
As the song of my youth by the Buffalo Springfield (remember them?) said, “There’s something happening here / What it is ain’t exactly clear / Stop, children, what’s that sound / Everybody look what’s going down.” (“For What It’s Worth”).
Your disconcerted and feeling the ground shifting analyst,

John Mauldin
P.S. If you like my letters, you'll love reading Over My Shoulder with serious economic analysis from my global network, at a surprisingly affordable price. Click here to learn more.
Tags
Suggested Reading...
|
|

Did someone forward this article to you?
Click here to get Thoughts from the Frontline in your inbox every Saturday.
