
The Distribution of Pain
-
 John Mauldin
- |
- November 10, 2017
- |
- Comments
- |
- View PDF
 John Mauldin
The Two Economies
Leveraged Stress
One Nation, Two Labor Markets
Working Class Versus Service Class
The Mushrooms!
Houston, Lugano, and Hong Kong
When you write about economics, you learn very quickly that the economy doesn’t care what you say about it. The forces that drive it are beyond any one person’s comprehension, much less control.
But at the same time, the economy doesn’t work like a law of nature. Unlike gravity, for instance, the economy responds to human choices and preferences. We influence it, even if we don’t understand exactly how.

In last week’s “Fragmentation of Society” letter, I wrote about the coming technological changes that will replace many human jobs and disrupt society. Some of the disruption will be good and necessary. Much of it will be painful, too, and the pain won’t be evenly distributed.
That is a problem whether you personally feel any pain or not. People don’t like pain and will change their behavior to avoid or relieve it. Like the drowning who desperately seek something to hold onto, they will vote for politicians who say they can relieve that pain, regardless of whether they actually can. And if those who suffer see that you don’t share their pain, they will wonder why not and seek to gain whatever advantage you possess. And then it gets ugly.
That’s not a moral statement but simply a fact-based observation of human nature. Whether we like the facts doesn’t really matter: We have to face them. Presently we are not handling them very well.
We have engineered society so that we at the upper end of the financial spectrum have little interaction with or knowledge of the people who feel the most pain. I wrote about this chasm between classes last year (see “Life on the Edge”) as the US elections made the split in our nation harder to ignore.
Peggy Noonan talks about the “Protected” class that makes public policy and the “Unprotected” who must live with those policies. The gulf between those classes continues to widen. The changes I wrote about last week will probably make it worse over the next 10–15 years.
Today I want to delve a little deeper into this widening split and consider where it may take us. As you’ll see, the possibilities range from “not so bad” to “very, very bad.”
Ray Dalio is no stranger to my readers. The billionaire founder of top hedge fund Bridgewater Associates got where he is by having keen insight into both human nature and economic trends. Occasionally he shares some of his wisdom publicly. I featured his reflections on the then-forthcoming Trump presidency in Outside the Box last December.
Last month Dalio posted a new article, “The Two Economies: The Top 40% and the Bottom 60%.” He believes it is a serious mistake to think you can analyze or understand “the” economy because we now have two of them. The wealth and income levels are so skewed between top and bottom that “average” indicators no longer reflect the average person’s experience or living conditions.
Dalio launches with this chart:
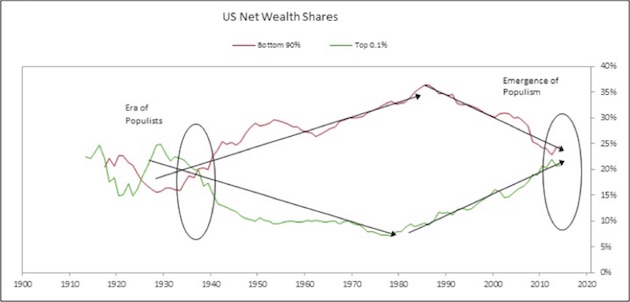
The red line is the share of US wealth owned by the bottom 90% of the population, and the green line is the share held by the top 0.1%. Right now they are about the same, but notice the trend. The wealthiest 0.1% has been increasing its share of wealth since the 1980s, while the bottom 90% has been losing ground.
Looking back, we see a similar pattern in the 1920s – which dramatically reversed in the following decade. Then there was an almost 50-year period during which the masses gained wealth and the wealthy lost ground.
(Important note: This doesn’t mean the 0.1% ceased being wealthy. It just means they owned a smaller portion of the total wealth. An economy in which 0.1% of the people own 10% of the wealth is still skewed, just less so. But more on that later.)
In the big picture, we see about a half-century when the net wealth gap widened in favor of the bottom 90%, followed by another 30 or so years in which the wealthiest gained ground while most of the population lost it.
Like what you’re reading?
Get this free newsletter in your inbox every Saturday! Read our privacy policy here.
It’s not a coincidence that populism emerged as a political force in both the 1920s–1930s and the 2010s. In each case, people at the bottom could tell the economy wasn’t working in their favor. The best tool they had to do something about it was the vote, so they elected FDR then and Trump now – two very different presidents but both responsive to the most intensely angered voters of their eras.
That previous, roughly 10-year period in which the green line was above the red line included the Roaring 20s, the 1929 market crash, and the first part of the Great Depression. For the 0.1%’s share of the wealth, 1929 was roughly the high point. Wealth lost in the crash sent their share plummeting. It has not fully recovered to this day, but it’s getting close.
Thinking about this situation, I can’t help but correlate it to my friend Neil Howe’s idea of a historical “Fourth Turning” every 80 years or so. It fits well with Dalio’s data. Neil said at my 2016 Strategic Investment Conference in Dallas that we are in the middle stages of that Fourth Turning, and he expects conditions to worsen from here. He repeated that warning this year at SIC in Orlando. As he points out, for almost 500 years the last half of Fourth Turning has always encompassed the most tumultuous times in Anglo-Saxon history.
(A Fourth Turning is a time when society’s foundational institutions are challenged. The generation who are young adults at that time must face the challenge, and hopefully overcome it. The so-called Greatest Generation did so by persevering through the Great Depression and fighting World War II. It may not be a war, but the Millennial Generation will face a similar test.)
Back to Dalio’s article. He goes on to quantify the 60/40 split with some startling numbers. Just a sampling:
• The average household in the top 40% earns four times more than the average household in the bottom 60%.
• Real incomes for the bottom 60% have been either flat or down slightly since 1980.
• In 1980, the average top 40% household had six times more wealth than the average bottom-60% household. Now it is 10 times as much.
• Only about a third of the bottom 60% saves any of their income.
Dalio also found some very useful data I had never seen before: household income adjusted to show the impact of taxes, tax credits, and government benefits. This adjustment gets closer to the resources people actually have available for living expenses, savings, and investment.
Splitting that data by the top 40% and bottom 60%, we see a sharply growing difference in the percentage changes since 1980. The top saw its after-tax net household income grow almost three times faster than household income for the bottom 60%, even including government transfer payments.
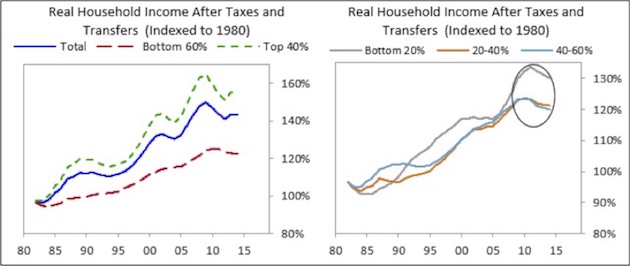
And note something in the right-hand side of the chart, which depicts income changes for the bottom 60% only, divided into three segments. There is a significant difference in the income growth of the middle 40–60% segment and the bottom 40%, too, and that difference accelerated during and after the Great Recession. Think about that in the context of recent political trends.
You see the problem here? The bottom 60% know their own experience. Thanks to the Internet and social media, the bottom 40% are particularly aware of it and increasingly resentful.
Note also that the lower ranks of the top 40% are not “wealthy” by any stretch. Anyone below the 80th percentile is probably struggling to some degree.
Since the 1980s most of us at the top have believed that a rising tide would lift all boats. We were half-right: It has lifted all the boats but not at the same rate, and a good many boats have sprung holes and are taking on water. We’re now near the point where our differences in income and wealth are too great to ignore.
Think back 30 years. None of us would want to go back and live with that same technological base. All of our lives have dramatically improved. From health care to communications to entertainment to transportation and a host of other things, we are all better off.
But the key here is that no matter how much better our lives have become, those in the bottom 20 or 40 or 60 or 80% notice the relative differences between where they are and where the top 10% or 1% reside, and they can see those differences growing.
While the majority of those living in Africa, in some parts of Asia, and in the slums in Latin America would see the lives of what we call the poor in America as vastly superior to their own lifestyles, that is not who the bottom 20–40–60% of the income strata in the US are comparing their lives to. It is simply human nature that we compare ourselves to those who have more, and that we want more for ourselves.
Last week the American Psychological Association released the results of its latest “Stress in America” survey. Not surprisingly, it revealed we are not happy campers.
Like what you’re reading?
Get this free newsletter in your inbox every Saturday! Read our privacy policy here.
A big majority (59%) think we are now at “the lowest point in our nation’s history.” To me, that seems a stretch, given that we killed each other in staggering numbers in the Civil War. And the 1820s was not a decade of great civility either. But then, people didn’t watch the fighting on their phones. Now we do, and it fills us with anxiety.
I look back on my youth and realize that the late ’60s was the first time when the reality of war confronted my generation in our homes, on our TVs and in our newspapers, every day. What we experienced with media coverage of social turmoil in that era was a harbinger of what the internet and social media have created today: instantaneous analysis of almost everything. Now, social media have become a monstrous breeding ground for conspiracy theories of all kinds. It is most disheartening.
The specific issues that worry people are interesting:
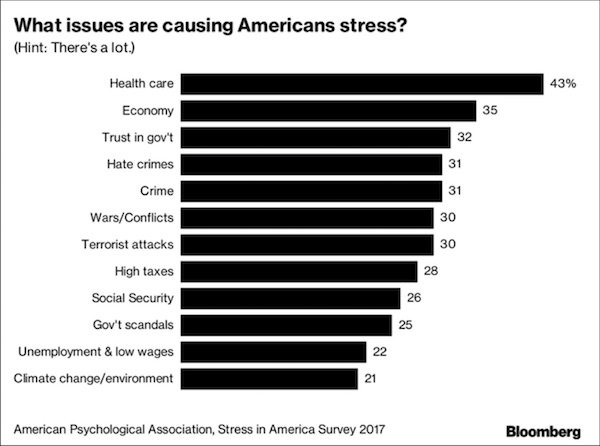
First on the list is health care, by a pretty wide margin. That concern can cover a lot of territory. Maybe you or a family member are seriously ill, or maybe your health is fine but buying insurance causes financial stress.
Just over a third of respondents reported that the economy causes them stress. That seems a little low, but I remind myself that most people don’t observe the economy the way I do. “High taxes” are well down the list, at 28%. That’s surprising but probably reflects the fact that a small number of people pay most of the income taxes.
“Unemployment and low wages” is also near the bottom with 22% of respondents stressed about it. Maybe that figure reflects today’s low unemployment level, or maybe people are just glad to have any sort of job.
One source of considerable stress that isn’t on the list but probably should be is household debt. I talk a lot about government debt and pension debt, but for most people the more immediate concern is probably their mortgage, auto, credit-card, and student loan debt. There is a mountain of it.
Here’s an interesting Deutsche Bank chart on that point:
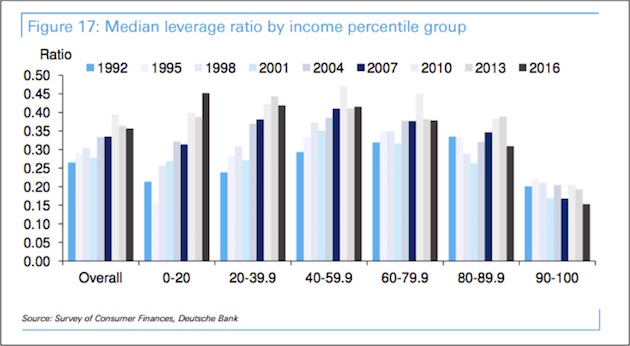
We see here household leverage ratios spanning 1992–2016, broken down by income quintiles. Focus your attention on the 1992 (darker blue) and 2016 (rightmost black) bars. In that 24-year interval, leverage more than doubled for the lowest-income 20% and rose significantly for the lower-income 80% of the population. It dropped slightly for the 80–89.9th percentiles and even more for the top 10% income group.
Now recall Dalio’s data on household income, adjusted for taxes and benefits. The top 20%, whose incomes grew the fastest, managed to reduce their leverage. The lower groups, whose income was up slightly or flat, added large amounts of debt, with the poorest adding the most, percentagewise.
This data doesn’t tell us what specific kinds of debt create these leverage ratios. Maybe some of the debt is productive, like mortgages on reasonably valued homes or student debt that helps borrowers eventually raise their incomes. But I’d bet much of the money that was borrowed is simply gone with little or nothing to show for it.
This likely-unrecoverable debt also appears as an asset on some lender’s balance sheet. It ends up being sold as asset-backed securities, possibly to a mutual fund or pension fund near you. And it’s generally in the high-yield category, with leverage on it.
At the risk of repeating the obvious, debt that can’t be repaid won’t be. Somebody will eat the loss; the only question is who. Banks managed to socialize much of their losses in the last recession. I’m not sure that plan will work a second time.
I started off talking about pain and how we distribute it. It may not be physical pain. Financial and employment-related pain are very real. Boredom, too, can be painful, as can loneliness or the feeling that no one needs you. We’re on the verge of many medical breakthroughs, but we won’t cure every disease or heal every kind of wound. People will still suffer, and it’s clear we need a lot of societal as well as personal healing.
In a recent column on Bloomberg, Jeanna Smialek and Greg Quinn write:
Goldman Sachs economists agree with Bridgewater Associates’ Ray Dalio: The U.S. economy is running at two speeds.
Headline joblessness may be at a more than 16-year low, but that bullish trend obscures the fact that the labor market is split into two “quite different stories,” Goldman Sachs economists write. A pool of would-be workers remain on the sidelines, and there are reasons to think they can be pulled back into the game. The share of discouraged workers has shrunk, and people are even coming back into jobs from disability. If the labor market gets as hot as it was back in 1999–2000, the economists think participation could climb by a few tenths of a percentage point.
That conclusion is important. Goldman had been skeptical that a tight labor market could push up participation, so this marks a shift in their thinking. If the Fed concurs, it leaves the central bank with a tough choice: should the rate-setting Federal Open Market Committee run the economy hot to attract disenfranchised workers, even if that risks overshooting on inflation amid low headline unemployment? “The FOMC seems to find this trade-off unappealing and is likely to continue to tighten steadily as a result,’’ the economists write.
While the Goldman analysis focuses on the labor market split, Dalio pointed out that aggregate statistics mask a division in labor, retirement savings, health care and wealth building. The common theme is that uneven outcomes mean the Fed must take underlying details into account when assessing economic progress.
Like what you’re reading?
Get this free newsletter in your inbox every Saturday! Read our privacy policy here.
Working Class Versus Service Class
One final thought, which we will be revisiting in detail in future letters as we think about the future of work. We have had this notion of the “working class.” These are the people who do not own the businesses and are not professionals in the sense of being doctors or lawyers or accountants.
I have spent a great deal of time thinking about the future of work. It is the single most difficult chapter to write in my upcoming book, partly because I don’t like the conclusions I’m coming to. One of the things I am realizing is that there is a distinction between what we have seen as the working class and what I am coming to see as the service class. A working-class person is somebody who has a trade, and because of their skill, they can generally command a decent income.
Then there is the service class – bar and restaurant workers, retail salespeople, general manual laborers, and so on. These jobs are almost plug-and-play. It is not that the greedy restaurant owner doesn’t want to pay his staff more; it’s that competition generally won’t let him do so and still make a profit. So he holds his labor costs down; and he can do so, because in today’s market there are typically more people available for jobs than there are jobs. And because of the Obamacare mandate, if you are a business with more than 50 employees, you simply cannot afford to have full-time employees; so you resort more and more to part-time positions, which do not allow a worker to earn an adequate wage.
Health care being number one of the worry list? I think a large part of that is the fact that young people are required to buy ridiculously expensive health insurance packages in order to subsidize a sick elderly population. And if you’re making $10–$12 an hour working two part-time jobs, trying to figure out how to hold onto a place to live, eat, have adequate clothing, and a bit for entertainment, you’re just not able to spend $400–$600 a month on health care. And then you find out that your taxes are much higher than you thought they would be because now you have to pay the penalty for not having health insurance. Yes, that might stress me out, too.
And yes, I do know young people in exactly that situation. Several of my children literally cannot afford to buy health care, so dad does it for them. But many other friends don’t have parents who can buy them what is essentially ridiculously expensive health care, because the parents are struggling with their own healthcare costs.
We are a nation that is increasingly under stress. Dalio talks about it in terms of the bottom 60% versus the top 40%, but he could have made the same case using an 80–20 model or even a 90–10 model. I am reminded of Pareto’s 80/20 principle, which states that roughly 80% of effects come from 20% of causes.
Our socioeconomic situation is not going to get better, not for a long time. Let’s assume, wildly optimistically, that the US economy and the rest of the developed world grow at a 5% nominal rate for the next 15 years, so that our economies roughly double. Does that mean that the gap between the lower 60% and the upper 40% will be even wider? We will have more than a few people who will be worth more than $100 billion, that’s for sure.
Will the lives of those in the lower 60% be significantly better than they are today? Absolutely. They’ll have improved health care and health spans (if they have access to health care), lower food costs, far more access to services, etc., but the relative differences will be even greater between the top and the bottom.
Unless we somehow figure out how to help people deal with their stress and better manage the yawning differences in incomes and outcomes, we’re going to see increasing tension and fragmentation in our society.
A few weeks ago I promised that I would give you my recipe for mushrooms, so here it is. I realized that the problem in sharing the recipe is that I seldom make mushrooms for fewer than 20 people and usually closer to 50; and I really don’t measure anything out but just go by taste and long experience; so I’m just going to give you the ingredients, and you can experiment.
First, I like to use several kinds of mushrooms, particularly baby portobellos (or creminis), regular portobellos, shiitakes, and the more typical white button mushrooms. After washing them, my preferences is to take off the stems. Unless they are too big, I don’t chop the mushrooms up. Even the giant portobellos I will slice only into three or four large pieces.
If I’m cooking for 40 or 50 people I make two types of mushrooms, so I will give you both recipes, but the basics to start with are the same. Dice up at least one large onion and sauté it gently until it’s clear. I prefer to use Kerrygold butter from Ireland. I might sauté the onions with just one stick of butter, but I will eventually put in at least a pound of butter and maybe more, depending on my mood. (These are not your low-calorie, cholesterol-free mushrooms.) I then begin to add mushrooms, along with a very-good-quality olive oil. Please, don’t use cheap olive oil.
For seasoning, I have come to like the smoked salt you can get from Whole Foods, along with their smoked semi-coarse pepper. I begin adding salt and pepper along with Cavender’s Greek seasoning. If you have to go online to get it, then do that – it really does make a difference. Fresh rosemary is important, too.
The first version of mushrooms is a cream-based version. I start adding whipping cream (yes, I know) and Chardonnay. I like to use a fairly decent Chardonnay. Add freshly crushed garlic – but not too much in this version. By this time some of the mushrooms have begun to soak up the sauce, so I can add more mushrooms and more butter, olive oil, and seasonings. Then I will add a little real Vermont Maple syrup here and there to taste. Add more mushrooms as the mushrooms shrink down, along with maybe some more butter, olive oil, and cream if necessary. Check the sauce and the seasoning. It is always easy to add more seasoning, but it’s really difficult to take it back.
Like what you’re reading?
Get this free newsletter in your inbox every Saturday! Read our privacy policy here.
The second type of mushrooms is a bit more traditional. I use more crushed garlic, a good red wine and, depending on my mood, maybe a little (not too much) Maple syrup. I also use a very good aged balsamic vinegar.
You don’t want to cook either of these mushroom dishes with too much heat. If your sauce starts boiling, turn the heat down.
Then let the mushrooms simmer, and if you have a lid to put on the top of your pan, do so. The longer the mushrooms stay in the sauce, the more of that flavor they’re going to pick up. And the sauce (either one) is great on any of the foods you are serving along with the mushrooms. Either sauce is particularly good with the prime recipe that I gave you a few weeks ago.
I guarantee you those mushrooms will taste better than anything you can get in a restaurant. And part of the reason is that no restaurant could make any money if it had to charge what those mushrooms would cost, including markup. And if you cut back on the cost of the ingredients, it will make a difference in the taste.
Houston, Lugano, and Hong Kong
I’m in Houston tonight at the Rice University homecoming because of four personally fascinating circumstances. First, it’s my 45th class reunion.
Second, there will be a special reception for former editors of the student newspaper. Editing the Rice Thresher is one of my fondest college memories and was a tremendous learning experience. Understand, we had no journalism classes and no faculty oversight. The paper was entirely student-run. The size of the paper depended on how many ads we sold. We were still printing the paper on an old letterpress with handset type. I was told by the printers that I was the first editor in 50 years who actually knew how to come in and set the time, run the presses, etc. I grew up in a print shop setting type and still have ink in my blood. The third-generation owners of the printing company that produced our paper had been printing the Thresher for over 50 years. They possessed a wealth of historical and professional knowledge.
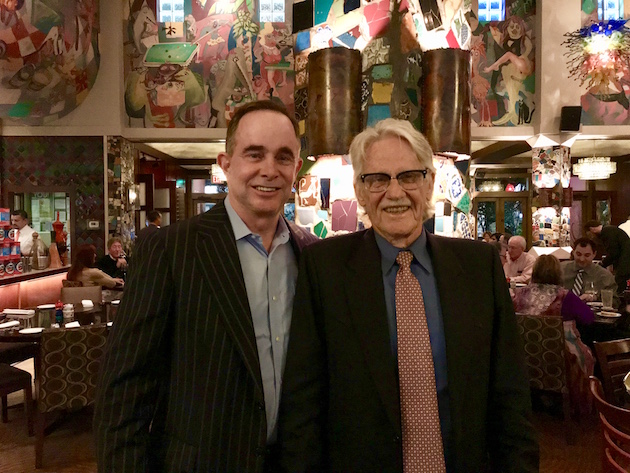
Third, tonight there was a public lecture by Vernon Smith, Nobel laureate and one of my personal economic heroes. I managed to wrangle an invitation to a small dinner, where I got to sit across from him and ask questions (see below).
And finally, earlier today, one of my new business partners, SMH (Sanders Morris Harris), a storied investment banking firm, had its 30th anniversary luncheon. I’ll tell you more about our relationship in the future.
A week from now I’ll fly to Lugano, Switzerland, for a presentation to a conference – and I’ll try not to push myself quite so hard on this next trip across the Pond. Shane and I will also be in Hong Kong for the Bank of America Merrill Lynch conference in early January.
Back to Vernon Smith. When you get a chance to sit across from one of the most conservative Nobel laureates ever – and a man who, at 90, is clearly still at the top of his game, you ask a lot of questions. I could do a whole letter around our conversation (if I had taken better notes) and his speech.
One moment in our conversation is, however, particularly memorable. One of my biggest macroeconomic puzzles (and one of my worst predictions – that is, one that so far has not come to pass) is that after the Bank of Japan monetized their debt, which they did, it would tank the yen. Clearly, that has not happened. There are no other circumstance that I can find in economic history that are even close to parallel. I asked Vernon (after he liked the Chardonnay I picked, he became Vernon) whether he had an explanation. He looked right at me and said, “No, I don’t understand it at all.” While I didn’t get an answer, at least he made me feel better!
Here’s a picture of Vernon and me at the restaurant. You will notice his hair is shorter than it was when he got his Nobel Prize. I would give you pretty good odds that he was the only Nobel laureate in economics who received his award while sporting a really long ponytail. Just one of those pieces of trivia that probably wouldn’t even win you a bar bet, but it’s interesting.
OK, time to hit the send button. You have a great week!
Your thinking hard about the future of work analyst,

John Mauldin
P.S. If you like my letters, you'll love reading Over My Shoulder with serious economic analysis from my global network, at a surprisingly affordable price. Click here to learn more.
Tags
Suggested Reading...
|
|

Did someone forward this article to you?
Click here to get Thoughts from the Frontline in your inbox every Saturday.
