
All Things Bullish
-
 John Mauldin
- |
- August 26, 2017
- |
- Comments
- |
- View PDF
 John Mauldin
Dow Theory Still Bullish
Elliott Wave Hangs On, Too
Your Own Personal Trading System
All About the Profits
Mr. Persistent
Trump Bump
Colorado, Chicago, Lisbon, Denver, and Lugano
“Bull markets are born on pessimism, grow on skepticism, mature on optimism, and die on euphoria.”
– Sir John Templeton
Dogs bark, birds sing, stock markets (and stocks themselves) fluctuate. Bonds, commodities, currencies, and all else that moves in the economic world will fluctuate. Only the economic market, however, transforms into a new beast when it changes direction to become a bull or a bear. Oddly, though, it’s not easy to objectively define either one: Observers see whichever they prefer to see.
Academic research has consistently pointed out that perma-bulls and perma-bears make far less profit than those who are cautiously optimistic. It’s key to remember that a wide world of economic opportunities lurks out there – you’re not forced to choose just your home-country stocks. Indeed, a home-country bias can be problematic.
Today we’ll look at reasons to be bullish on the equity markets, but I’ll also teach you a thing or two about trading. In my managed Mauldin Smart Core Portfolio, we are still basically long equities, but we have more and more exposure outside the US. And while for regulatory reasons I can’t discuss the details of my system in this letter, I can give you some simple guidelines that will at least help you to be in the market when you should be and to get out before disaster strikes.
As we noted last week in “All Things Bearish,” bearishly oriented investors see many reasons to be cautious now and little grounds for optimism. Others are stalwartly bullish. Naturally, I have friends on both sides of this debate, people with deep knowledge and experience. Problem is, they can’t all be right. The stock market will move up or down (or possibly sideways), and some of us will be wrong.
Now, let’s see what the bulls have to say.
Longtime readers know how much I admired the late Richard Russell, editor of Dow Theory Letters. Richard stuck to his methodology despite his own misgivings. By its nature, Russell’s version of the Dow Theory gives very long-term buy and sell signals. Richard left us in 2015, but other analysts follow strategies similar to his. According to newsletter tracker Mark Hulbert, these analysts are now uniformly bullish. Benchmarks confirmed the bull market by reaching new highs this summer.
One question remains. Dow Theory looks at the relationship between the Dow industrials and transports averages, and the transports have pulled back since mid-July. That shift might mark the beginning of a bigger downturn, or it might not. Here’s how Hulbert explains it:
Ominous though this sounds, however, Moroney and the other Dow Theorists I track are still bullish. That’s because the stock market must jump over three successive hurdles to generate a bear-market signal, and it hasn’t even cleared the first.
Those three steps are:
1. Both the Dow Jones Industrial Average and the Dow Jones Transportation Average must undergo a “significant” decline after hitting new highs – “significant” both in terms of time and magnitude.
2. In their subsequent “significant” rally following the decline referred to in step No. 1, either one or both of these Dow averages must [fail] to surpass their highs.
3. Both averages must then fall below their lows registered at the bottom of the decline referred to in step No. 1.
Notice that I put “significant” in quotes. That’s because there isn’t universal agreement on what magnitude of market moves is necessary to satisfy. Some Dow Theorists argue that, per Hamilton’s original indications, a move under the first step isn’t “significant” unless it lasts at least three weeks and corrects at least one-third of its previous move. On this interpretation, the market hasn’t come close to that first step.
Depending how you look at it, then, the Dow Theory signal is either in full-on bull market mode or might be taking a small step back. In either case, it is nowhere near bearish, and Dow Theory followers see no reason to sell. If anything, by their lights they should be buying more.
The Elliott Wave Principle, all the rage in the 1980s, is less influential now but is still watched by the technical analysis team at Goldman Sachs. The Elliott Wave comprises sequential upward and downward market moves – “waves” – that form repeating cycles. A full cycle has eight waves. Waves 1–5 are bullish, with only minor pullbacks between. Waves 6–8 are corrective, or bearish, and you do not want to be long when they happen.
The market is presently in wave 4, according to Goldman market technician Sheba Jafari. That means the next downturn will be limited and followed by another bullish wave. Then we would see a bigger correction.
Jafari explains this analysis with the following chart, published in Business Insider last week.
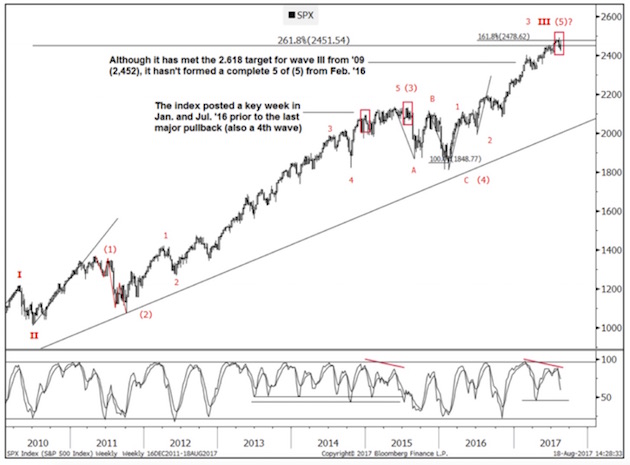
Like Dow Theory, Elliott Wave is very long-term. The correction between waves 4 and 5 could last a year or more. The bullish wave 5 could last another year after that. By this view we are still a couple of years away from a major bear market, with profits still to be made on the long side.
Am I convinced? No. But serious people are, and you should know what they’re thinking.
Like what you’re reading?
Get this free newsletter in your inbox every Saturday! Read our privacy policy here.
Your Own Personal Trading System
Both of the above systems are rather complex. Technical analysts develop their own highly nuanced systems, but these systems require years of dedication to use and understand. My own management system uses four separate traders who have radically different trading styles. Frankly, 95% of my readers couldn’t understand what they’re saying. I have been studying technical trading systems and methodologies for almost 30 years, and I struggle to keep up with these guys.
However, one simple rule of thumb can enable you to benefit from a bull market and avoid the worst of a bear market: When your stock or index goes above the simple 200-day moving average, you are in the market; when it falls below that average, you are out. I will explain some of the complications and caveats momentarily.
One of the greatest traders of all time, Paul Tudor Jones, runs about $13 billion. When he talks to groups, he advises people to use something like a 200-day moving average.
If you’re really interested in some of Jones’s wisdom, do a Google search on his speeches and papers and read them. Get some copies of the old Market Wizards books. But remember that most of us make our money from our day jobs, not investing. The first point of investing is to not lose the money you manage to save from your day job. Then second is to make that money grow. You have to recognize your opportunities and take them when they show up.
And remember Warren Buffett’s two rules of investing:
Rule No. 1: Never lose money.
Rule No. 2: Never forget rule No. 1.
I had my friend Steve Blumenthal send me the following four charts of the Dow, the S&P 500, the NASDAQ, and the Russell 2000. The first three are all above their 200-day moving average, and the Russell just dipped below its 200-day average. I post the charts so you can see the ebb and flow over time.
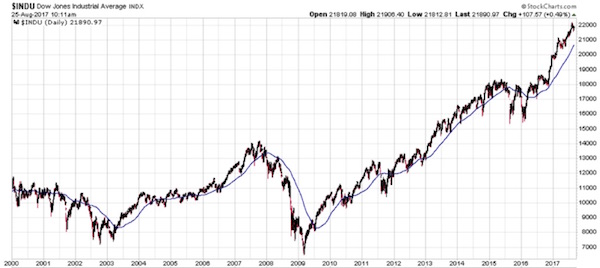
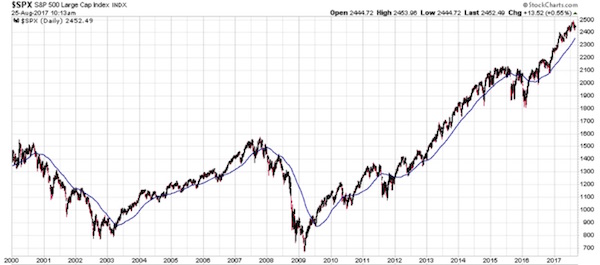
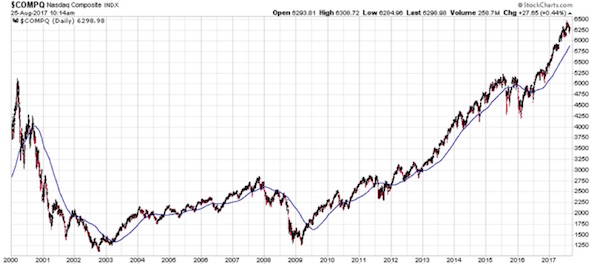
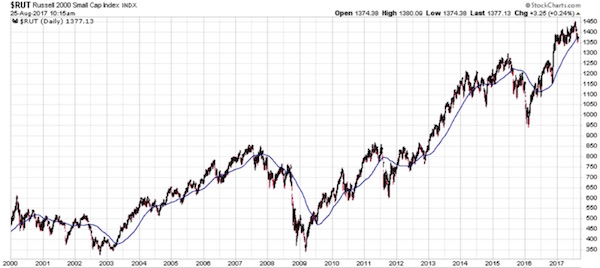
Relying on the 200-day moving average is not the best system, and some traders will note that point approaching and play games to take away some of your potential earnings. But if you don’t have a system, you’ll miss out, and the 200-day moving average works better than no system at all. It’s annoying when you get whipsawed, but that’s the price of not having to take a 25 or 30% drawdown. By whipsawed, I mean that the signal moves in and out several times quickly, and you’re constantly trading. Some “sophisticated” traders operate under restrictive parameters to dampen that action: They might wait for three days and then trade only on Friday or on a full moon in the effort to avoid getting whipsawed.
There are better rules and moving averages to use; but that’s what my clients pay me for, and I’m giving you this for free. Further tip: Different indexes and stocks and other markets have different relevant moving averages.
I should note that there are a lot of resources on the internet. For example, every Wednesday, Steve Blumenthal gathers updates from some of the best technical systems and generously posts the data for the past week in his letter Trade Signals. You can get a few of Ned Davis’s gonzo reports there, along with others.
You really have no excuse for living through a 40% drawdown. Or missing another 20% run-up because you’re nervous. Either position is simply intellectually and operationally lazy. Caveat: There is no perfect system. If you’re going to trade the markets, you are going to have losing periods. If it were easy, everybody could do it. But at least you can do the simple stuff to minimize the losses and maximize the gains. I know successful commodity traders who are right only 40% of the time. But they cut their losses quickly, and when they catch a big run it really makes a difference.
In my own money management system, I try to get what the market gives me but with dramatically less volatility. On average, you aren’t going to make more than the market gives you. There are no free lunches.
But when I tell you to have a system that allows you to hedge your investments, at least do that at a minimum. Do not simply be passively long and forget about it. You will not like the correction that accompanies the next recession – whenever it comes.
Let’s look at the fundamentals. When you buy a stock, you are really buying its future earnings: Each share’s price is the discounted present value of its expected future earnings. Prices change when expectations change, which happens for many different reasons.
The present bull market is still with us in large part because earnings are pretty good. With most of the second-quarter reports now in, FactSet reported in its August 11 letter a 10.2% blended S&P 500 earnings growth since the same period in 2016. Earnings grew in every sector except Consumer Discretionary.
Like what you’re reading?
Get this free newsletter in your inbox every Saturday! Read our privacy policy here.
More impressive is that companies also expanded their net profit margins.
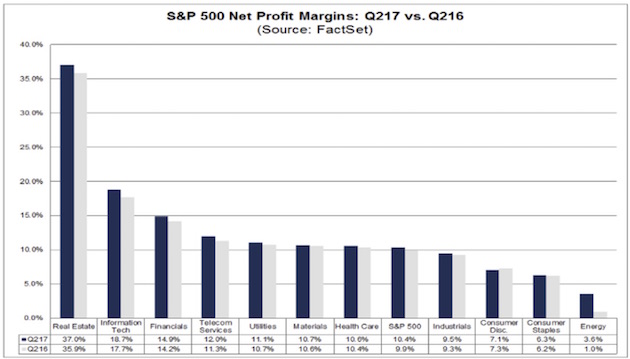
The bars above show net profit margins by sector for the second quarters of 2017 and 2016. The only sector to see compressed margins was Consumer Discretionary, and only by 0.2 percentage points.
Forget for a moment that these are public companies. Imagine it’s your own business. Not only are you nicely profitable, you are even more profitable on each dollar of revenue (which also grew) than you were a year ago. And that’s after you paid yourself a handsome salary and bonus.
Are you happy? Of course you are. Would you be eager to sell your business to someone else? Maybe, but you would ask a premium price for it. That’s essentially the calculation stockholders are making right now. Business is good and getting better. No reason to sell at anything less than full price, generously defined.
Reluctant sellers mean higher prices. That’s the foundation of this bull market. The market will likely fall if the foundation erodes, but that hasn’t happened yet.
In writing this letter, I reached out to my contacts looking for an uber-bull – someone utterly convinced that the market is on solid ground, with good evidence for their view.
Fortunately, a good friend who must remain nameless shared with me an August 4 slide deck from Krishna Memani, Chief Investment Officer of Oppenheimer Funds. He thinks the present bull market will continue for another year and opens his argument with this colorful graphic. (I could not find an actual link to the website, but if Krishna will send it to me I will post it next week.)
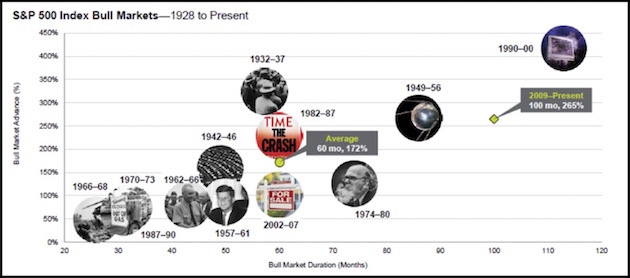
Each circle represents a bull market that occurred since 1928. The vertical axis shows percentage gains, and the horizontal axis duration. The current bull is the second-longest and has the third-highest gain. It will be the longest stock bull market of the modern era if it can last another two years or so.
Here’s Memani:
For some investors, the sheer age of this cycle is enough to cause consternation. Yet there is nothing magical about the passage of time. As we have said time and again, bull markets do not die of old age. Like people, bull markets ultimately die when the system can no longer fight off maladies. In order for the cycle to end there needs to be a catalyst – either a major policy mistake or a significant economic disruption in one of the world’s major economies. In our view, neither appears to be in the offing.
He goes on to list 15 specific events he thinks would be necessary to make him abandon his bullish position. (Comments in parentheses and italics are mine.)
1. Global growth would have had to decelerate. It is not.
(European growth is actually picking up. Germany blinked on financing Italian bank debt, and the markets now have more confidence that Draghi can do whatever it takes.)
2. Wages and inflation would have had to rise. They are not.
3. The Fed would have planned to tighten monetary policy significantly. It is not.
(They should have been raising rates four years ago. It is too late in the cycle now. They may raise rates once more, but the paltry amount of “quantitative tightening” they are likely to do is not going to amount to much. In fact, if for some reason they decided to go further with rate hikes and enter a real quantitative tightening cycle, their monetary policy error would probably trigger a recession and a deep bear market. I think they realize that – or at least I hope they do.)
4. The ECB would have to tighten policy substantially. It will likely not.
(Draghi will go through the motions, though he knows he is limited in what he can actually do – unless for some unexpected reason Europe takes off to the upside. And while Eastern Europe is actually doing that, “Old Europe” is not.)
5. Credit growth would have had to be surging. It is not.
(Credit growth is generally picking up but not surging. And most of the credit growth is in government debt.)
6. Corporate animal spirits would have been taking off. They are not.
(That is basically true for most public corporations. There are a number of private companies and smaller businesses that are pretty optimistic. See my story below.)
7. Equities would have had to be expensive relative to bonds. They are not.
8. FAANG stocks would have had to be at extreme valuations. They are not.
(I don’t think I buy this one.)
9. Investors would have had to be euphoric about equities. They are not.
10. The current cyclical rally within the secular bull would have had to be old and stretched. It is not.
(Not buying this one either.)
11. High-yield spreads would have had to be widening. They are not.
(I pay attention to high-yield spreads, a classic warning sign of a turn in market behavior. Are they at dangerous levels? Damn, Skippy, I cannot believe some of the bonds that are being sold out in the marketplace. Not that I can’t believe the sellers are willing to take the money – you’d have to be an idiot not to take free money with no strings attached. I just don’t understand why major institutions are buying this nonsense.)
12. The classic signs of excess would have had to be evident. They are not.
(Kind of, sort of, but we are really beginning to stretch the point.)
13. China’s credit binge would have had to threaten the global financial system. It does not.
(Xi has somehow managed to push off the credit crisis, at least for the rest of this year, until after the five-year Congress. Rather amazing.)
14. Global trade would have had to be weakening. It is not.
15. The US dollar would have had to be strengthening. It is not.
That’s quite a list. Seeing it with the charts and Memani’s comments makes it even more compelling. To pick just one for closer scrutiny, let’s consider #7. Are equities expensive relative to bonds?
That’s a good question because it really matters to big, long-term investors like pension funds. Pension fund managers need to meet certain return targets, and they want to put the odds on their side. Treasury bonds offer certainty – presuming the US government doesn’t default. (Ask me about that again in October.) Stocks may offer higher returns but more variation.
Memani explains this relationship by looking at earnings yield. That’s the inverse of the P/E ratio. Essentially, it’s the percentage of each dollar invested in a stock that comes back as profits. Some gets distributed via dividends, buybacks, etc., and some is retained. Compare earnings yield to the 10-year Treasury yield over time and you get this:
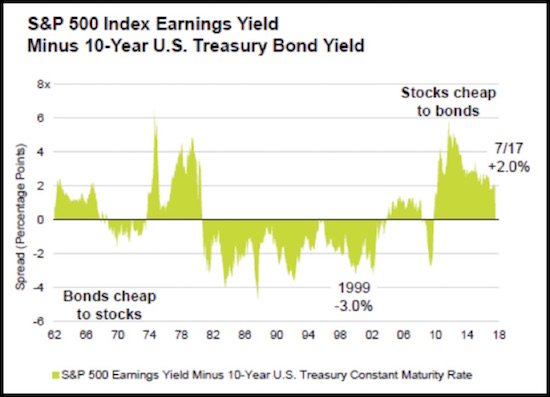
If you think there’s a stock mania today akin to the euphoria of the late 1990s, you’ll find no support in this graph. Back then, bonds were dirt cheap compared to stock market earnings yield. Now we have the reverse: stocks are cheap compared to bonds.
This is one of the most convincing bullish arguments I see now. I remember the late ’90s very well. I called the top about three years early, never dreaming we could see a year like 1999. That will always be my mania benchmark – and today we are not even remotely near it. I don’t remember thinking much about bonds back then. No one else was, either. But buying them would have turned out much better than buying stocks in 1997–99.
Like what you’re reading?
Get this free newsletter in your inbox every Saturday! Read our privacy policy here.
At Camp Kotok on Saturday we had a different “old Maine” guide than we’ve had in the past. Guiding is a side business for him. He is a 4th-generation millworker who runs a nice small-business operation in Bangor, like his dad and granddad and family before that. If you want high-end woodworking, he’s one of the go-to guys in that part of Maine. Naturally, I asked him how business is and has been over the years.
He talked about the ups and downs and then said something that piqued my interest. Business had been flat to down for 2015 and 2016. He said the day after the election, it was like somebody switched the lights on. He now has an 18-month backlog. He’s got every worker he can find going at it. Note: He wasn’t particularly a Trump fan, but he did acknowledge that the election really ignited not only his but other small businesses in the area. And you can see that in the confidence surveys.
Let me end this letter by quoting from my friend Sam Rines’ missive today:
The “Trump bump” has been declared dead. That is simply not true – yet. So where is the Trump bump hiding? For one, business confidence remains at its highest level since the second quarter of 2014, according to the Business Roundtable CEO Economic Outlook Survey. And it is not just CEOs; consumers feel the same way – only better. Consumers feel the best they have in a long time. The Conference Board’s Consumer Confidence Survey sits near a sixteen-year high. But this will not last forever. The policies that led to Trump bump need to come to fruition to maintain the dwindling euphoria.
Initial jobless claims remain quite low. The August Markit US manufacturing and services composite index rose 1.4 points to 56, its highest level since May 2015. The breakdown was mixed, though, as manufacturing fell 0.8 points to 52.5 but was more than offset by a 2.2-point increase in the services component, to 56.9. Markit highlighted the bifurcation in the release by saying, “The US economic growth story remained a tale of 2 sectors in August.”
Base metal prices are actually rising, which is a sign of increased global demand and recovery.
If for some reason we have a cyclical correction in what is otherwise a bull market, I would look for an active V-shaped recovery. Think 1987 and 1988. We won’t get an honest-to-God bear market with a long, drawn-out recovery, which would be worse next cycle because of the overwhelming debt that is going to be a drag on growth. That is, we won’t see a real bear until we get a recession. But dear gods, you do not want to be long anything (other than bonds) when we get close to a recession.
For now it’s basically a bull market. My own management system has reduced overall equity exposure over the last five years, but we’re still significantly long. If you would like more detail on how I think you should manage your money in these times, you can go to MauldinSolutions.com, give us some simple information, and we will get you my white paper and updates. If you are an independent US advisor or broker and looking for a way to manage client portfolio risk, I hold monthly meetings at my home where I serve chili and prime, and then the next morning you can sit down with my managers and talk about what we are doing that is significantly different from what most other advisers are doing. I encourage you to think about joining Team Mauldin.
Colorado, Chicago, Lisbon, Denver, and Lugano
As I write this, I am actually on a plane flying to Denver, where Shane and I will grab a car and drive to Beaver Creek for four days, then return to Denver, where I will be meeting with advisors in the area on Wednesday and Thursday, getting home in time to celebrate Labor Day with the family.
Late in September I will be in Chicago for two days for a speech, fly out the next day for Lisbon, and return to Dallas to speak at the Dallas Money Show on October 5–6. I will speak at an alternative investments conference in Denver October 23–24 (details in future letters). I will again be in Denver November 6 and 7, speaking for the CFA Society and holding meetings. After a lot of small back-and-forth flights in November, I’ll end up in Lugano, Switzerland, right before Thanksgiving. Busy times.
With all of my research and the launch of the new business, I’ve been especially busy. Making the Mauldin Solutions announcement and putting myself out there has opened up all sorts of new possibilities, some of which must be explored. Thankfully, I have very competent partners and associates who can help me sort through everything and follow up. Cautious optimist that I am, I’m admittedly surprised by the large response that we’ve had so far. First-World problem, of course. Frankly, an entrepreneur’s dream. I truly believe that with some of the exciting additions that we’re putting in place, I’m going to be able to give you a much broader range of possibilities for making it through the next 10 years, during and after the Great Reset.
Someone asked me the other day, what is my driver? What gets me going in the morning? I have all sorts of answers to that question, but one strong motivation is that all of the research I’ve done on where our future is going makes me believe that the vast majority of investors, my fellow Americans, and much of the world are not ready to deal with the Great Reset. The rules of investing are going to change – not the basics, but the techniques and strategies that will work. We’ve seen such changes in the past. We are getting ready to go through something no less tumultuous than the 1870s and 1880s. Go back and read about Cornelius Vanderbilt and his contemporaries. They were building an investment world where the rules were literally made up as they went along. We are going to have to be equally inventive.
What drives me is that I want to help my readers and my friends not only to get through what’s coming but also to take full advantage of all the new opportunities. And to avoid the pitfalls, of course. I think this is going to be one of the most exciting, transformative times in human history.
And with that, you now find me sitting in the Admirals Club in the Denver Intl. Airport, getting ready to hit the send button and then let Shane drive while I read yet more research. How did I ever get along without her? Nowhere near as well, as she points out from time to time.
Your feeling like I’m living a dream analyst,

John Mauldin
P.S. If you like my letters, you'll love reading Over My Shoulder with serious economic analysis from my global network, at a surprisingly affordable price. Click here to learn more.
Tags
Suggested Reading...
|
|


Did someone forward this article to you?
Click here to get Thoughts from the Frontline in your inbox every Saturday.
