
Inflation and Honest Data
-
 John Mauldin
- |
- March 3, 2018
- |
- Comments
- |
- View PDF
 John Mauldin
’80s Flashback
Data from Afar
Not Theoretical
Some Thoughts on the Trump Tariffs
San Diego and the Strategic Investment Conference
I’m going to wrap up our series on the problems of collecting and analyzing data in the first half of this letter, and then I’ll quickly comment on the Trump tariffs. I think both topics will feature in this week’s Strategic Investment Conference. At the end of the letter there will be a link to our Virtual Pass, which will allow you to watch the conference live or at your leisure and to read the transcripts of the presentations.
I strongly urge you to follow me on Twitter, because I will be very active during and after the conference, sharing my real-time thoughts. My Twitter handle is @JohnFMauldin. Do it now! Now let’s look deeper at the problems with data.
Coming up with the right monetary and fiscal policies is hard even if you know the outcome you want, and even if everyone else agrees. Neither of those conditions is normal. We’re often unclear on our policy goals, and we certainly don’t even agree on them.
We could all argue less if we could trust and use the same data, but that’s not happening, either. I’ve been discussing this vexing problem in recent letters. It’s a multiplex challenge to define what data is relevant, to collect it accurately, and then to analyze it correctly. A weakness anywhere in that chain will compromise the whole effort.
Yet none of this means we should despair that the task is impossible. First, some folks out there will think it is possible, and ceding the choices to them could leave us with even worse results. We all contribute in one way or another to human progress, even if we don’t agree on what it looks like. Humans have spent millennia observing problems and finding ways to solve them. Some of us invent better tools and methods, and the rest of us either accept or reject them. Hence, you get to read this letter online today instead of on paper next week – and it’s free, to boot.
Economic analysis tools get better, too, though what “better” means is not always clear. But smart people are trying. Today we’ll look at some of these efforts and how they might help. Specifically, we’ll consider some alternative inflation measures that may be better than those I discussed in last week’s “State of Inflationary Confusion.”
In the course of inventing new tools you sometimes you find that the old tools weren’t so bad and might even have been better than your “improved” versions.
My friend John Williams at ShadowStats fervently believes that the changes that the Labor Dept. made in the ’80s and ’90s seriously distorted the Consumer Price Index. Reverting to the pre-1980 methodology, he estimates that CPI inflation is running close to 10% today.
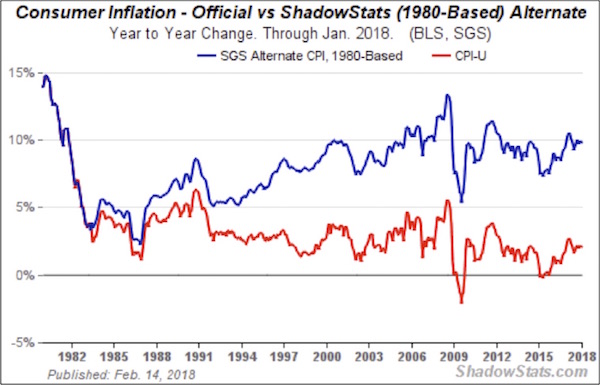
As I’ve noted in recent letters, I think it’s likely that today’s official CPI understates inflation in some categories. But does it underestimate inflation as much as John Williams thinks it does? I think that is clearly not the case. The government changed its CPI methodology because the economy evolved. Experts believed the old methods were themselves misleading.
Looking at John’s chart above, you can see that most of the divergence happened in the 1990s. Official CPI-U growth ran in the 3–5% range, while John’s 1980 version rose from 5% to almost 10% by the year 2000. The growth rates have been nearly equal since then.
What was happening in the 1990s that might explain this? I can think of two possibly big factors:
• The internet and other rapid technological changes
• Globalization and trade agreements like NAFTA
Both of those influenced prices downward, and the 1980 CPI method wasn’t designed to capture the shift. I’m just speculating, but maybe applying the old rules in a new environment resulted in the overweighting of sectors with higher price inflation.
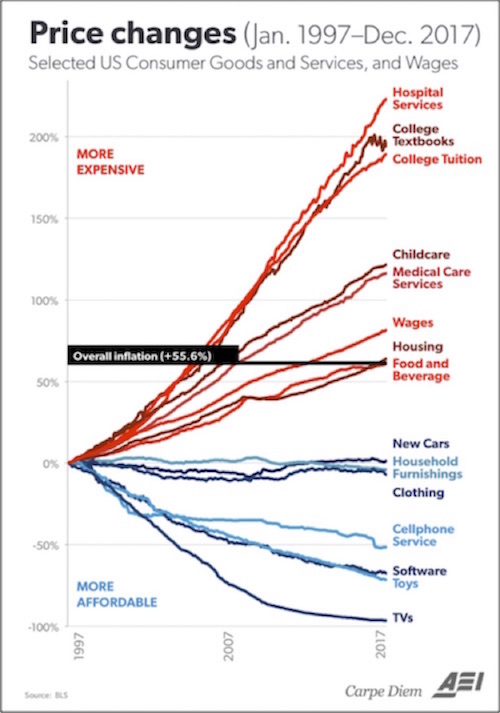
Notice in the chart below that it is the high-inflation items that are most influenced by government – things like health care and government-subsidized education. (If you think education is not influenced by the government, you are not paying attention.) The items that are not growing in price? Those are more purely market-driven.
Speaking of inflation, you might recall that Argentina had a few rough years not long ago under socialist President Cristina Fernandez de Kirchner. The official inflation stats were more than suspiciously low, given the near-universal experiences of actual people. The International Monetary Fund threatened to expel Argentina at one point, before the government revised its data methods in 2013. I often traveled to Argentina during that time and wrote about the massive difference between the official dollar-peso exchange rate and what you could get on the street. Stores really did not want to take my credit cards. If you went to Argentina, you needed cash dollars to exchange for pesos. Inflation was running several hundred percent and climbing fast.
Like what you’re reading?
Get this free newsletter in your inbox every Saturday! Read our privacy policy here.
During that time, Alberto Cavallo, an Argentine economist at MIT, decided to estimate Argentina’s inflation rate from his remote perch in Massachusetts. He gathered price data from online retailers and constructed a new index which, not surprisingly, showed far higher inflation than Argentina’s government admitted to at the time.
From that experience Cavallo and another MIT economist, Roberto Rigobon (from Venezuela and no stranger to inflation himself), launched the Billion Prices Project (BPP). The number is not an exaggeration. Each week they get prices for thousands of goods from hundreds of retailers in dozens of countries. The resulting massive database reveals all kinds of interesting trends. There are numerous charts and free research on their website. (The data is available for commercial use through an associated company, PriceStats.)
Their methodology sounds ideal, but it has limitations. Some important prices aren’t readily available online in every location – rent, for instance, or college tuition. Those prices require different estimates and adjustments. Also, limiting the data to online sales channels omits the much larger proportion of offline economic activity. Lower-income people tend to fall into the offline category, so BPP may misjudge some aspects of their experience.
Still, the “big data” method is promising. It was certainly better than the flawed and/or manipulated Argentina inflation data that launched the idea. It’s also broadly consistent with official data, at least in the US. You can see how well the two measures match in the following charts. The blue “PriceStats” lines are the BPP data; the red lines are Bureau of Labor Statistics (CPI) data.
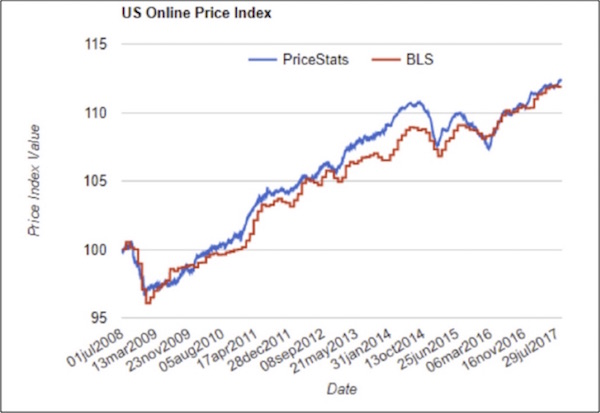
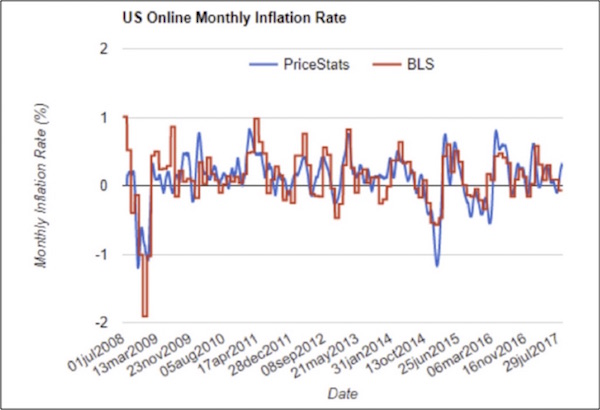
This is a small bit of good news in the data puzzle. Here we have two different organizations, using different methodologies and data inputs as they attempt to measure the same thing, and they are getting quite similar results over time. But other problems remain. As I emphasized last week, every household has its own spending patterns, so it’s all but impossible for any aggregate figure to accurately reflect inflation as you or I experience it. No one is actually “average” in that way, so we should use the data cautiously.
The Billion Prices Project may also reveal something about the thorny, quality-based “hedonic” adjustments that the Labor Dept. makes. Financial Times writer Tim Harford discussed this issue in a 2016 article about BPP:
The BPP is also shedding light on some old economic mysteries. One is the problem of adjusting inflation for changes in quality. To some extent this is an intractable problem. The Edison phonograph cost $20 at the end of the 19th century; an iPod Nano costs about $145 today. What inflation rate does that imply over the past 117 years? There is simply no good answer to that question.
[Sidebar: $20 in 1900 would be $598 today, roughly 30 times inflated, which means that the iPod Nano, which can hold literally 1 million more songs than the original Edison phonograph, costs less than one dollar in 1900 dollars. While they are both ways to play music, comparing their prices in two different eras is like comparing apples to polar bears. But the phonograph and the Nano do illustrate the problem of measuring the progress of technology and improvements in lifestyles just in terms of dollars.]
Here’s Harford again:
But statistical agencies are always wrestling with smaller slices of the same problem. A new model of washing machine is introduced at a premium price, gradually discounted over the years and eventually sold at clearance prices and replaced with a swankier model. The same thing is happening over differing timescales with computers, summer dresses and cars. If the economic statisticians mishandle these cases, they will get their measure of inflation badly wrong; usually they rely on careful substitutes and clever theory, but success can never be assured.
Cavallo and Rigobon argue that the sheer volume of prices collected by the BPP helps resolve the problem. Every day, the project gathers the prices of hundreds of washing machines. By observing that the availability of the Scrub-O-Mat 9000 overlaps with that of the Cleanado XYZ, it’s possible to adjust as new products are introduced and old products discounted and then phased out.
In other words, if you have enough data and you measure it frequently enough, the quality adjustments come out in the wash, so to speak. There’s no need to retroactively adjust months or years later, as CPI does. So that’s helpful.
But that is the point. No matter how you measure inflation, you are measuring the average inflation impacting 330 million people in the US and 741 million people in Europe. And as different as inflation may be from Texas to New York, I can guarantee you that inflation in Greece is even more different from inflation in Sweden or Switzerland.
In the eurozone, the ECB is trying to maintain a single monetary policy for 340 million people, which makes their situation roughly analogous, at least in terms of population, to ours in the US. But the differences across those countries are significantly greater than the differences among the US states. And how about the Bank of Canada? You think Nova Scotia, Québec, Ontario, and British Columbia have the same underlying inflation rate, especially if you factor in housing? Canada’s GDP is roughly 10% the size of the US’s or the eurozone’s, and its population is 10% smaller than California’s. And does anyone want to suggest that inflation is equal among all the regions of California? And yet the Fed treats the data as if that were so. (A new study just out shows significant inflation in rent in Los Angeles County, which does not show up in the “owner equivalent rent portion of US inflation data simply because OER is estimated on home prices and not actual rents. Go figure.)
Some of us are old enough to remember the rolling regional recessions of the ’80s. Nearly every region experienced a significant recession at some point, while the rest of the country was doing just fine. And the Federal Reserve, rather than creating a special monetary policy for Texas in the late ’80s, when all of our banks were going belly up and our housing market was in the sub-basement, had to manage an entire country with one policy. Seriously, the joke at the time was that the last person to leave Houston should turn out the lights.
We could have used much lower rates. We might still have Texas banks today if we had been cut that slack. Texas had to quickly change the law against non-Texas-based companies owning Texas banks. Texas was left with one small regional bank (Frost Bank), which still exists today and is the only truly Texas-owned bank. There was no help from the Fed as there was in the 2008 crisis for US and especially New York banks. Just saying…
Whether we are talking about inflation, unemployment, or any other stat, the elephant in the room is that the final number that makes the headlines represents highly massaged data. That might be all right if we all treated the number as the approximate construct that it is. We don’t. People in power, like Federal Reserve officials, accord the numbers far more confidence than they should. And the numbers that support their decisions go right into the models, which then affect the rest of us and have real, immediate impacts on the economy.
A small glimmer of hope: New Fed Chair Jerome Powell seems aware of the problem. He said so, gently, in his opening remarks to Congress this week.
In evaluating the stance of monetary policy, the FOMC routinely consults monetary policy rules that connect prescriptions for the policy rate with variables associated with our mandated objectives. Personally, I find these rule prescriptions helpful. Careful judgments are required about the measurement of the variables used, as well as about the implications of the many issues these rules do not take into account.
Like what you’re reading?
Get this free newsletter in your inbox every Saturday! Read our privacy policy here.
Indeed, careful judgments about the data and the models that apply it are required. Every business, from the smallest of the largest, knows that it is important to have the best measures to accomplish their goals. Whether data management and policy formulation will improve under Powell remains to be seen. I hope he realizes that the economy is far too complex to encapsulate in anything small enough to fit on their conference table.
You have certainly heard the story about blind men touching different parts of an elephant and variously describing what they think an elephant is – a rope, a fan, a tree trunk, etc. That’s roughly how monetary policy works in both the US and other countries. A group of humans wander in the economic murk, each sensing conditions and arriving at his or her own conclusions. We end up with policy designed by a committee of confusion. There are better ways. I would not count on our central bankers finding them, because they have been trained that their data gathering and their modeling are valid, necessary, and useful.
The Fed is steeped in the theory that allowing the markets to actually set interest rates would be devastating. Instead, the process needs the all-seeing guidance of 12 people sitting around a table. How could the world possibly end up with the correct price of money (short-term interest rates and the level of the money supply) without their economic wisdom? It is much the same as when doctors in the 1800s resisted washing their hands, even when confronted with research demonstrating that handwashing resulted in fewer infections. They believed in their superior knowledge and training.
The proponent of washing hands, Ignaz Semmelweis, who was unaware of the existence of bacteria, simply noted that hospitals for the poor where hands were washed had much lower mortality rates among newborns. For this insight he was committed to an asylum, beaten by the guards, and died 14 days after he was committed. It was only after Louis Pasteur discovered bacteria and Joseph Lister created new hygienic methods that doctors slowly changed their minds.
What will it take for our own economic intelligentsia to realize that they need to wash their hands? Leaving the market to set rates by itself wouldn’t guarantee smooth sailing. Nothing can. But it would provide better signals to the marketplace and to businesses. Purposely manipulating rates lower for long periods of time sends signals to businessmen and investors to act differently than they would otherwise do. And that distortion creates its own set of imbalances. Which approach is worse? We may never know.
Some Thoughts on the Trump Tariffs
As it turns out, my short comments on the Trump tariffs are evolving into a rather long essay that I must save for another day. But for now, let me say this. There are no easy answers, as one man’s lower prices are another man’s lost job. I understand the frustration of those who feel that “our jobs” have been taken, because they can look around and see factories closed. It is easy to blame China, but China sends us less than 2% of our steel imports. And the Chinese are trying to shed 1.5 million jobs from their own steel industry. Think about that figure in the context of 140,000 total jobs in the US steel industry. That’s 140,000 US steel jobs versus the 6 million jobs in companies that actually buy and process steel and aluminum, which will now cost more, with the price increases passed straight through to consumers.
(The single most important problem we need to solve with China – if we really want to do something significant – is to deal with the massive theft of US and European intellectual property. But that is a much more difficult issue than can addressed by simply imposing tariffs.)
If the US imposes the tariffs Trump has outlined, we will face potentially asymmetric effects as politicians in other countries feel the need to respond and to levy tariffs on our agricultural and technology products. You will be hard-pressed to find a serious economist of any stripe or persuasion that thinks a trade war is easy or winnable. But that doesn’t speak to the angst of the worker who lost his job. Look at this headline from Bloomberg this morning. We are going to be seeing lots more like this.

The amount of steel that China ships to the US means nothing to China. But the symbolism of the tariffs offers Chinese leaders an opportunity to posture in front of their own citizens. Ditto for European leaders. Will cooler heads prevail? Count me among those who are very concerned about the potential for massive overreaction on the part of politicians in a world where populism is burgeoning.
So rather than dive more deeply today into what is a very thorny issue, I think I need to wait and make this a series of letters in which we look at what the early 19th-century French economist Frédéric Bastiat would likely have termed the seen and the unseen effects of tariffs and globalization.
San Diego and the Strategic Investment Conference
I can guarantee you that the steel and aluminum tariffs and the potential for a trade war will be a hot topic both on the stage and among the attendees at SIC this week. I will make a special point of highlighting comments from speakers when they mention the tariffs. Follow me on Twitter @JohnFMauldin.
This year’s SIC has the potential to be our most explosive and interesting conference ever. There is no better lineup to deal with tariffs and trade wars and scores of other important issues than the one we have assembled.
Even if you can’t attend in person, you can experience every minute of the Strategic Investment Conference in real time, because we will be live streaming the conference directly to you via the SIC Virtual Pass. And if you can’t watch in real-time, you can view at your leisure and/or read the transcripts and review the slides. You can actually ask questions to the speakers in real time, too, from wherever you are in the world.
I wish you could all join us in San Diego March 6–9; but if you can’t, the Virtual Pass will give you some of the same valuable (and fun!) experience. Click here to learn more.
Like what you’re reading?Get this free newsletter in your inbox every Saturday! Read our privacy policy here. Twenty-five of the world’s top money managers and investment strategists are gathering to discuss how they are positioning their portfolios for the coming market turbulence. You can watch and listen as they dig deep into the convergence of market-moving events about to hit your portfolio. |
As excited as I am about the coming week, I know that I have a lot to do in the next few days to prepare for the week. There are hundreds of details, like reading the manuscript of George Gilder’s latest book, Life After Google, which I need to finish before I conduct an interview with him. That’s just another 80,000 words or so. Plus wrapping up the details on PowerPoints, meetings, and sorting through what will be a packed schedule. I am totally grateful for the experienced staff that makes it all happen. We have used the same technology team for the last 14 years to pull the conference off, and backstage has far more computing power than the US used to put a man on the moon. Last year I counted over 20 monitors. It is hard to imagine how much work goes in making every detail of this conference successful. I actually have the easiest role: I simply have to figure out which speakers to invite and what order to put them in. A rather large team handles all the rest.
This is the most exhilarating week of my year. And many of the attendees are as excited about the conference as I am. We have so many attendees who have been coming for 10 years or more. Each year, it seems they say this was the best conference ever – and every year I strive to make it better. I am very hopeful about this year, but as they say, the proof will be in the pudding. At least the world events we have to deal with are not boring…
I will arrive in San Diego Monday afternoon to make sure I am there on time for a special gathering of many of the members of the Alpha Society on Tuesday afternoon. I know that some of you will be there in time for dinner; and if you are, and you see me, come say hello. And with that I will hit the send button and wish you a great week. I hope you can join us, at least virtually, as we explore the potential for the weeks, months, and years ahead. What could be more exciting?
Your grateful to be part of the team analyst,

John Mauldin
P.S. If you like my letters, you'll love reading Over My Shoulder with serious economic analysis from my global network, at a surprisingly affordable price. Click here to learn more.
Tags
Suggested Reading...
|
|

Did someone forward this article to you?
Click here to get Thoughts from the Frontline in your inbox every Saturday.
