
Year of the Octopus, Part 2
-
 John Mauldin
- |
- January 12, 2018
- |
- Comments
- |
- View PDF
 John Mauldin
Optimism and Hong Kong
Easterling: Correction and Continuation
Jensen: The US Is 1980s Japan
Lebowitz: Buy the Dip?
Lewitt: Charts Point to Caution
Insights from Lacy Hunt
Housel: What a Time to Be Alive
Boston and Baltimore
Only two weeks in and 2018 is already breaking records – mostly in a good way. But that leaves 50 potentially less enjoyable weeks to go. So rather than focus on promising current events, I think I’d better dip back into my annual forecast bag and share a few more highlights with you.

Getty Images
First, let me mention that you have just two days left to accept your Alpha Society invitation. After January 15, society membership will be closed for at least another year. So if “stop procrastinating” is one of your New Year’s resolutions, here’s your chance to get off to a good start. (Plus, you can try Alpha Society out for 30 days and get a refund if you don’t think it’s a good fit.)
Looking down the road, I think this is going to be Alpha Society’s best year. Just in the next couple of months, we have our first-ever quarterly conference call with the Mauldin Economics editors, Alpha Society-only get-togethers at the SIC, and lots more. I hope you’ll join us.
Last week I called 2018 “the Year of the Octopus” because it has so many tentacles. There are many more than eight, so I should probably have made it the Year of the Centipede. In any case, let’s run through a few more projections from my still-growing pile.
Two years ago, when I was at the same Bank of America Merrill Lynch investment conference that I attended last week in Hong Kong, the mood in the room was quite somber, even bearish. The sentiment, shared by many at that gathering, turned out to be wrong.
Last week (while still suffering mightily from jet lag) I had a good conversation with my host, Ajay Kapur (who could not have been more delightful), in which we noted the mood of this year’s conference, which was almost universally upbeat. There was a clear consensus among these very seasoned and powerful traders. Given how wrong the mood was last time, Ajay and I wondered whether we should perhaps be a little trepidatious about the Chinese, Hong Kong, and other Asian markets. I’m not sure what to make of the mood this year, but I just thought I would share that experience. Now let’s move on to the forecasts of some of my other friends.
Easterling: Correction and Continuation
We’ll start with Ed Easterling’s invaluable Crestmont Research. Ed is one of the top experts on market valuations. We looked at some of his work right after the 2016 election (see “The Trump Rally Will Morph”), specifically concerning price/earnings ratios. P/E is a good timing indicator over very long periods, but stocks can stay overvalued or undervalued for years. The P/E has stayed between 10 and 25 most of the time but can move way above or below that range and stay there awhile. As of this writing, the S&P 500 trailing P/E ratio is around 22 – elevated but not signaling imminent doom. It’s higher by some other metrics.
Here’s a bit from Ed’s year-end update:
P/E is above sustainable levels and beyond the level that is appropriate for a low-inflation environment. Regardless of whether the current environment is designated as a secular bear or secular bull, an elevated P/E means that returns over the next 5–10 years will be below average, and years with excess returns (like 2017) simply pull forward future returns and increase the magnitude of subsequent corrections.
By Ed’s methodology, stocks are still in the bear market that began back in 2000. P/E ratios troughed at a below-average level, as you can see in the lower right of this chart.
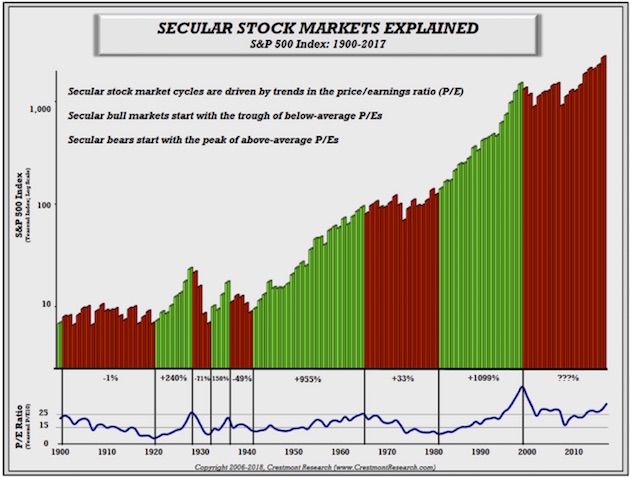
The next bull cycle won’t begin until the P/E ratio troughs somewhere below 15. That means prices have to drop considerably from here. Will it happen this year? I think probably not, but Ed says it better than I do:
Outlook: Two of the mostly likely scenarios for this year are Correction and Continuation.
Correction recognizes that the current level of valuation is unsustainable. Therefore, the inevitable result is a decline in the market to levels that can provide an appropriate return.
The level of return for financial assets is driven by the inflation rate. Higher inflation drives higher bond yields and higher stock returns. Thereby, markets adjust the prices of financial assets to adjust the level of investment return as the expectation for future inflation moves up or down. For example, higher inflation drives bond prices lower, which results in higher yields. Likewise, higher inflation drives stock prices lower (i.e., lower P/Es) in order to result in higher stock market returns...and vice versa.
Valuation matters. Prices for bonds and stocks can become overvalued or undervalued. This occurs when prices get out of line with the expected level of inflation. Currently, inflation is low and P/E should be high; but the current level of P/E is well beyond the level associated with a low inflation environment. Today’s excessively high P/E for the stock market could portend a correction back to the level of P/E that is appropriate for the expected inflation rate environment.
Keep in mind, when inflation is below average, stock market returns will appropriately be below average. Today’s expected low inflation environment means that P/E should be above average (just not this much above average), which means that future returns from here will be well below average.
Continuation reflects a market with additional momentum. Further gains in the market could be driven by a pickup in the economy. Recent tax and regulatory changes are likely to promote economic production, which should drive stronger economic growth.
Although valuations and profit margins are elevated, the effects of good economic news could propel prices further.
As Ed says, valuations should not be this high while inflation is this low. Yet they are. That disconnect will get resolved at some point but perhaps not imminently.
Niels Jensen of Absolute Return Partners is a rarity: a risk manager whose writing is informative and entertaining at the same time. Hard to imagine, I know – risk managers specialize in spoiling parties. But Niels is different. Visit his Absolute Return Partners site to read some of his letters, and you’ll see.
In his latest, Niels lists five top predictions for 2018:
Like what you’re reading?
Get this free newsletter in your inbox every Saturday! Read our privacy policy here.
1. Turbulent Brexit negotiations taking the UK to the cliff edge.
2. General elections in Italy turning the country anti-EU.
3. Mayhem in Saudi Arabia leading to a dramatic rise in oil prices.
4. Synchronized GDP growth leading to rising wage inflation.
5. The US equity market turning into the Japan of the late 1980s.
He then explains them in more detail, which you can read here. I’ll quote his point on the US turning into Japan because I think it has some similarity to Ed Easterling’s outlook above.
Now to the final one of my five concerns. Japan of the late 1980s – what do I mean by that? As I am only too aware that not all my readers are as old as I am, allow me to summarise what happened in Japan in the late 1980s.
Back then Japan delivered the mother of all bull markets. Equity prices kept going up and so did property prices, with investors paying little attention to economic logic. At the peak, the land surrounding the Imperial Palace in Tokyo was said to be worth more than all of California! The Japanese even have a name for that extraordinary bubble: バブル景気.
The bubble was characterised not only by inflated asset prices but also by a largely uncontrolled money supply, excessive credit expansion, and disproportionate monetary easing. Does that ring a bell? By the early 1990s, it was all over, and the decade of the 90s turned into what is now known as the Lost Decade.
What I don’t like about US equities right now is that they defy logic, just as Japanese equities defied reason back in the late 80s. US valuations are not only out of whack with those of other equity markets around the world but also relative to past valuation levels:
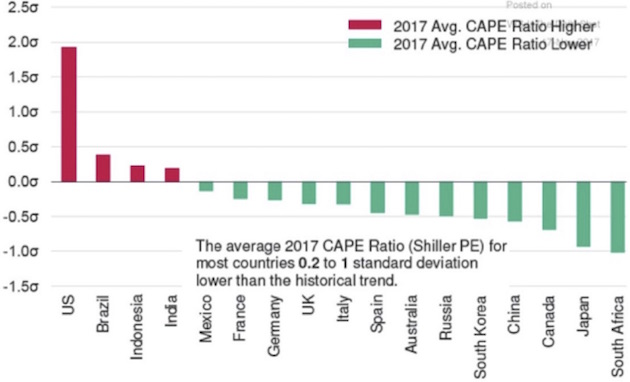
Equity valuations in various countries
Source: Moody’s Investor Service, The Daily Shot
Niels continues:
Furthermore, as a result of inflated equity prices and strong property markets, US wealth is accumulating at a faster pace than anywhere else (exhibit 7). The best way to measure how much asset price inflation has affected wealth in the US is to zoom in on the wealth-to-GDP ratio, which is long-term constant. (Note: I don’t intend to go into any level of details here as to why that is, but it is a major topic in my forthcoming book.) The US mean value is 3.8, and I note that wealth is now in excess of 5 times GDP in the US; i.e. total wealth will have to drop 25–30% for equilibrium to be reestablished.
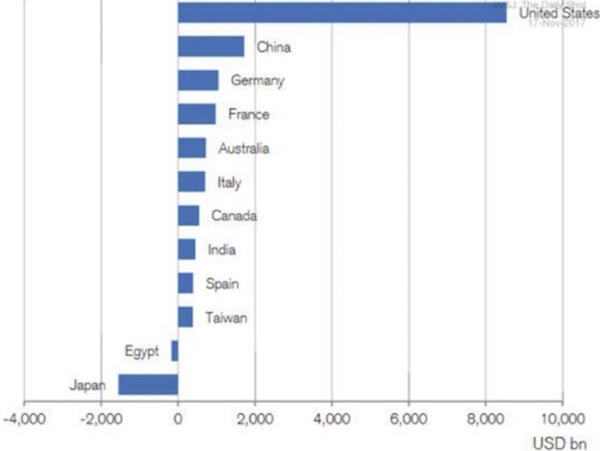
Change in total wealth, 2016–17 ($bn)
Source: Credit Suisse Global Wealth Data Book 2017, The Daily Shot
In other words, it is only a question of time before risk assets take a significant hit in the US, and I am prepared to stick my neck out and suggest that 2018 could be the year when the adjustment phase begins.
Having said that, one thing I also learned from the Japanese experience is that, when bubbles rage, asset prices can defy logic a lot longer than what you think is possible. There is absolutely no reason why the bubble cannot get even bigger before it eventually blows up, but blow up it will.
I agree with that last part. The stock bubble can get bigger and probably will, making the eventual implosion even more painful. As of now, bears are still easy to find, so we don’t seem to be near a capitulation point, but it is coming.
One of my newer favorite macro analysts is Michael Lebowitz of 720 Global. He has a way of cutting through the numerical fog to make important points jump out at you. You can read his full “Investment Outlook 2018” here. Below are some highlights.
The primary investment theme remains “buy the dip.” That approach has worked amazingly well, a testament to the sustained strength of markets. Thanks in no small part to gradualism from the Fed on interest rate and balance sheet normalization, the blind assumption is that the favorable trajectory of risk assets can be endlessly extrapolated into the future.
There is a distinct difference between taking a defensive posture and a negative one. Remaining full-bore aggressively long at this juncture is a speculative endeavor akin to letting our kids play in the median of a busy highway. Proper care and stewardship of wealth means being protective and forward-looking to avoid large losses.
Outlier scenario – The market is far more sensitive to changes in interest rates than currently perceived. If the Fed continues to increase the Fed Funds rate and reduce their balance sheet in response to low unemployment and moderate levels of inflation, economic activity will decline. The result is a recession that initiates the unwinding of leverage accumulated in the system compounded by and revealing many layers of hidden risks.
I think Michael’s bond outlook is especially important. I bolded some key points below.
US Treasury yields are bipolar. Short maturity yields are rising with Fed rate hikes while long-maturity yields are stable to lower. This dynamic produces a flattening of the yield curve revealing short-term optimism and long-term doubt. On an absolute basis, yields remain very low. The 2-year Treasury yield is 1.82% while the 10-year yield is 2.40%. The 2s–10s yield curve spread resides at the lowest level (0.58%) since the financial crisis of 2008.
Investors looking for income in the safety of the Treasury market will die of thirst long before achieving their targets. Accordingly, many investors are reaching for additional yield in riskier categories, namely high yield credit and dividend-paying stocks. This game has been going on for a long time. Despite the relative yield enhancement those alternatives offer, the question of whether or not an investor is appropriately rewarded for taking that risk still exists.
Non-investment grade, or “junk” bond, yields range from 4% to 10%, depending on the company and sector, with the overall average yield at about 5.75%. A bond is relegated to junk status precisely because of the elevated risk of default. At current market yields, junk bonds pose an inordinate threat of record low recovery value and terminal realized yield. Using the average yield for junk bonds of 5.75%, an average default rate of 5% and a generous recovery rate of 50%, a high yield debt portfolio is mathematically identical to a risk-free asset with a yield of 3.25%. That amounts to a risk-adjusted premium of only 0.85% over 10-year Treasuries (3.25 – 2.40). A yield pickup of less than 1% is hardly compelling, especially when one considers [that] the downside from current valuation levels is immense.
Investors who think they get a nice yield boost from owning high yield debt are not considering the risk-adjusted outcomes. The risk-adjusted premium over Treasuries should be at least 200 to 300 basis points. Fixed-income portfolio allocations should reside predominantly in the defensive havens of high-quality sovereign, well-selected municipal and investment-grade corporate bonds. We recommend no allocation to junk.
As Michael says, many yield-seeking investors have jumped into junk bonds without fully weighing the risks. I’m very interested in that segment, too, but not yet. I’ll buy when yields are much higher and the risk-reward balance is more compelling.
Lewitt: Charts Point to Caution
Another favorite of mine who really should get more attention is Michael Lewitt. He writes The Credit Strategist, which always gives me good fodder for thought. Here are some excerpts from Michael’s January forecast issue.
Stocks: Last year, like many others, I underestimated the power of the bull market as central banks poured another $2 trillion into the markets. My 2017 prediction of an 1800-2400 range on the S&P 500 was way off as markets exhibited the lowest volatility in history and never experienced even a 3% correction. My range is very wide again in 2018 (3000/2300) and we could easily hit the high end of my range at some point during the year. The reason for this is that, despite the charts shown above, the structure of markets favors stocks – fewer shares outstanding due to stock buybacks, 50% fewer public companies today versus 20 years ago, few attractive fixed income alternatives, and ETFs and other passive strategies hoovering up huge amounts of mindless capital. There are fewer places for people to invest their money, and Wall Street makes it easier than ever to invest it in stocks with very little intellectual effort.
I expect higher volatility in 2018 as central banks tighten and stocks start to see more competition from the short end of the curve. I expect the VIX to trade at an average closer to 15 than 10 in 2018. There will be more opportunities for short sellers (if there are any left) to make money in 2018 while long-only and index investors will have a tougher go. It would be very surprising if 2018 were anywhere as easy as 2017 was for bulls (and if people thought their famous managers had trouble making money when the market was rising, how do they think they are going to do when the market is struggling?).
Bonds: I expect short rates to rise another 50–75 basis points as the Federal Reserve raises the Federal Funds rate three times in 2018. The 2/10 Treasury curve flattened by 65 basis points (to 53 basis points) in 2017 as the 10-year yield fell by four basis points (from 2.45% to 2.41%) and the 2-year rose by 69 basis points (from 1.19% to 1.88%).
The yield curve will likely flatten further and may come close to inverting as short rates keep rising and the 10-year yield squeezes closer to 3%, a level that may spook markets in a US economy carrying ~$60 trillion of combined public and private sector debt.
It is hard to see how 10-year yields won’t exceed 3% next year if 2-year rates track three 25-basis-point hikes in the Fed Funds rate, so this is something to watch very closely. If 10-year yields exceed 3%, stocks will likely react poorly; if they don’t, we will know that we are truly in the blow-off phase of a bubble.
That last part is key. I think a 3% yield with no credit risk in 10-year Treasury bonds could tempt many income-oriented investors out of stocks and corporate bonds. Why take equity risk in a market at historically high valuations for a 2% dividend yield (2% if you’re lucky)? Worse, yields at that level might start pulling pension money out of stocks, too. A 3% T-bond yield is quite reasonable if the Fed stays its present course.
Like what you’re reading?
Get this free newsletter in your inbox every Saturday! Read our privacy policy here.
Lacy Hunt was at the conference in Hong Kong with me, and while he acknowledges that there is reason for optimism, he feels that in general the economy is likely to be slower this year than it was the last three quarters of last year. Part of that is the savings rate, and part of it is the Fed’s having to reduce the monetary base in order to raise rates. That is just simply a drag on the economy. I will have Lacy’s full Hoisington Management letter for you as an Outside the Box in a couple of weeks, so you can get the entire sense of what he is saying, but there seems to be a common theme among his and other forecasts that I have shared this week: Caution is warranted. The markets could go up a lot further, but be careful out there.
Housel: What a Time to Be Alive
These forecasts have been generally negative, and I don’t want to end on a downer. I believe we’ll get through whatever challenges 2018 throws at us, and we may even be better off for it. In that spirit, here’s an uplifting piece from Morgan Housel.
John D. Rockefeller was the richest man the world had ever seen.
But for most of his adult life he didn’t have electric lights, air conditioning, or sunglasses. And he never had penicillin, sunscreen, or Advil. This is not ancient history: One in twenty Americans were born before Rockefeller died.
The majority of Americans think the next generation of adults will be worse off than their parents.
I think of two things when I hear this.
One, the pessimists are probably wrong, extrapolating a bad decade into infinity. Two, progress is like compound interest – you don’t even notice it in the short run, but it’s mind-blowing when you zoom out and see what can be accomplished over long periods.
There are so many things still wrong with the world, and the future will always be hard. But when confronted with pessimism, Warren Buffett reminds us that normal Americans “live better than John D. Rockefeller did.”
From there, Morgan goes on to list several dozen examples of how right Warren Buffett is. You can read them here. By all sorts of criteria, most of us in the developed world live better than the world’s wealthiest man did a century ago. That some of us still have the gift of life at all shows the progress in medicine, and better is coming. We have technology and luxuries Rockefeller couldn’t even have imagined. It really is worth clicking on that link and just appreciating how much better things are today than they were just 50 years ago. I continue to be very bullish on the human experiment. On our little experiments with governments, maybe not so much…
That doesn’t mean we have no challenges. We have many, chief among them making our progress more accessible to everyone. I believe that will happen and that I will live long enough to see it, as will most of you reading this. The future is bright.
Right now, I am scheduled to fly into Boston for a series of meetings and then will in theory make my way down to Baltimore to meet with Patrick Cox and to review some new medical developments. What wonderful times we live in.
On Saturday in Hong Kong my friend Peter Churchouse took Lacy and I and our wives, JK and Shane, on a trip around the harbor in his racing yacht. It was quite windy, so we were clipping along at a good pace even though we were inside the harbor. At the end of that exhilarating tour, I offered to buy Peter a drink, as he always seems to be doing things for me. So we walked over to the Excelsior Hotel, where there is a famous bar down in the basement called the Dickens. Peter, Lacy, and I said at one end of the table and our wives at the other. Peter is a very astute investor, and it didn’t not take long before he and I had engaged Lacy on some rather technical economic issues that I knew would be boring to our wives; but they seemed to be enjoying themselves immensely, laughing and having fun. When we broke up about an hour later, we learned the reason for their high spirits. Every time someone in men’s group uttered the words yield curve, the gals would clink their glasses and take another drink, thereby turning our rather sober economic conversation into a fine drinking game.
Now, before I hit the send button, I want to tell you about a special five-part series I have put together for you, in which I delve deep into minds of the five individuals who have been most influential in shaping my worldview. It took me hundreds (yes, hundreds) of hours of writing and thinking through the content to put it together, so I’m excited to hear what you think about it.
The purpose of this series is to share with you the most important insights that I’ve gleaned through my personal conversations with these five great minds. These individuals have changed how I view the world, our economy, and the future of society. I say, without hesitation, that you are going to learn so much from these essays. I encourage you to check them out for free, here. Please note, we are releasing the content over several days, so don’t worry about the two articles that can’t be viewed yet – I’ll send you an email when we release them.
Your still suffering from jet lag analyst,

John Mauldin
P.S. If you like my letters, you'll love reading Over My Shoulder with serious economic analysis from my global network, at a surprisingly affordable price. Click here to learn more.
Tags
Suggested Reading...
|
|


Did someone forward this article to you?
Click here to get Thoughts from the Frontline in your inbox every Saturday.
