Clock’s Ticking on Your Chance to Profit from the Yield Curve Inversion
- Robert Ross
- |
- The Weekly Profit
- |
- June 12, 2019
The markets are in the middle of a once-in-a-decade event.
And it says a lot about what you should do with your money right now.
I’m talking about a critical recession indicator called the yield curve inversion—or the Diamond Cross—which we’ve been tracking closely here at The Weekly Profit.
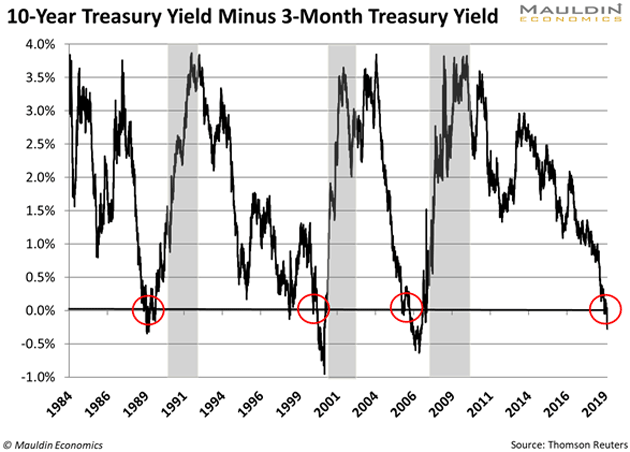
As you may recall, a Diamond Cross happens when the difference between the yield on the 10-year Treasury note and the 3-month Treasury bill is negative. This is a telltale sign that the economy is slowing.
The Diamond Cross popped up briefly in March, only to return on May 15. Last week, it was the steepest, or most severe it’s been since April 2007.
And I’m sure you remember where we landed 12 months after that…
The Crisis That Followed
By April 2008, the US was suffering through its worst economic slowdown since the Great Depression.
A lot of people were taken off guard. But investors who pay attention to the Diamond Cross shouldn’t have been surprised. That’s because the Diamond Cross has preceded every single recession over the past 50 years.
Today, we’re heading toward another recession. Just not immediately…
The Diamond Cross appeared an average of 18 months before the last three recessions, as you can see in the next chart. (Diamond Crosses are circled in red and recessions are highlighted in gray.)
I expect a similar gap this go ‘round.

Nevertheless, the Diamond Cross is a definite sign that investors are worried.
Here’s why…
These Are Strange Times
You probably know that US Treasuries are bonds issued by the US government—the safest lender on the planet. So, they’re about as “risk free” as you can get.
The US Treasury issues these bonds for different periods of time, ranging from three months to 30 years. This period is called the bond’s “maturity.”
Normally, investors demand higher yields for longer-term bonds. And for good reason.
See, you can predict short-term economic and geopolitical changes with some degree of certainty. But no one really knows what will happen in 10, 20, or 30 years.
Long-term bonds are a gamble on the unknown. So people demand higher yields.
But the Diamond Cross flips this all on its head. When it appears, like it did on May 15, it means investors are demanding higher yields for shorter-term bonds. That means they’re pessimistic about the short-term future.
Once again, this shouldn’t surprise anyone who’s been paying attention. The US economy has expanded continuously for almost nine years. That’s a long time.
Since the end of World War II, the US has hit a recession every five years, on average. So we’re long overdue.
But remember, a Diamond Cross appeared around 18 months before the last three recessions. So it’s coming, just not tomorrow.
In the meantime, I expect stocks to follow a similar pattern…
Stocks Should Climb Until September 2020
There’s an upside to all this: A Diamond Cross is always a positive sign for stocks in the short term.
Just look at how the S&P 500 rose after the last Diamond Crosses:

At the 18-month mark after the last three Diamond Crosses, the S&P 500 had returned an average of 32%. Pretty respectable. For perspective, that’s the same return on the S&P since July 2016.
At this rate, stocks should continue to climb until September 2020 or so. That said, now is not the time buy with wild abandon.
A Word of Caution
Although stocks historically rise after the Diamond Cross, you still need to be picky.
This recession is coming, folks. So is the market downturn. You want to steer clear of excessive risk.
That means buying safe and reliable dividend-paying stocks—especially in resilient industries like consumer staples, defense, and utilities.
Regular readers know I think investors take on too much risk, even in a “normal” environment.
And right now, things definitely aren’t normal. We’re in the longest bull market in US history. Eventually, the music will stop, and the markets will correct. They always do.
We got a taste of this at the end of 2018, when the S&P 500 fell as much as 20% over three months.
That’s why you need to protect yourself from the inevitable pullback—but without missing out on the post-Diamond Cross momentum.
It’s a balancing act. That’s why I’m holding a free webinar later this month to lay out specific steps you can take to profit as this all plays out.
I’m calling it the Any-Weather Income Strategy Summit. And it’s going down on Monday, June 24 at 2pm ET.
During this special event, I’ll reveal the one sector set to soar above the rest in this post-Diamond Cross environment—along with a free stock pick.
If you’d like to join me and thousands of others who have already signed up, please click here.

Robert Ross

