
Outside the Box: Hoisington Investment Management Quarterly Review and Outlook, Second Quarter 2013
- Patrick Cox
- |
- July 25, 2013
- |
- Comments
Lacy Hunt and Van Hoisington kick off their second-quarter Review and Outlook with a contrarian view: "The secular low in bond yields has yet to be recorded." And as usual, they have their reasons; but unlike most of the blabbermouth economic talking heads out there, they aren't interested in endlessly parsing the fitful utterances of Ben Bernanke and friends. Rather, they zero in on the fundamental reasons why long-term Treasury yields have probably not hit their low. Those reasons fall, they say, into four categories: (a) diminished inflation pressures, (b) slowing GDP growth, (c) weakening consumer fundamentals, and (d) anti-growth monetary and fiscal policies.
Then Lacy and Van take us deep into the whys and wherefores of their thesis. Their reasoning and the evidence behind it make for compelling reading – but you may want to read twice.
Hoisington Investment Management Company (www.Hoisingtonmgt.com) is a registered investment advisor specializing in fixed-income portfolios for large institutional clients. Located in Austin, Texas, the firm has over $5 billion under management and is the sub-adviser of the Wasatch-Hoisington US Treasury Fund (WHOSX).
I write this note from Newport, Rhode Island. There is a reason that the rich and powerful built their summer mansions here a century ago. It is disarmingly beautiful. The weather gods have arranged a perfect day and evening, the waters are calm, and the sailboats are out in force. All is right with the world. The Defense Department Office of Net Assessment futures planning group I am with uses the facilities of the Naval War College here. we enjoy a charming hotel on Goat Island, surrounded by boats and tourists, in the evenings and experience the rather drastic contrast of a military facility beset by the rigors of sequestration during the day. Air conditioning is one of the casualties of Congressional inaction, it seems.
I am enjoyably assaulted by new ideas and issues each day, and often find myself very far afield from my usual intellectual haunts. We are tasked with developing outside the box future scenarios. Economics is just a small part. It is good to stretch the mind.
Have a great week, and read what Lacy writes carefully. Everybody is rushing to the other side of the bond boat, trying to catch a stiff breeze that could just turn on the sailors. Be careful out there.
Your feeling woefully but happily inadequate analyst,
John Mauldin, Editor
Outside the Boxsubscribers@mauldineconomics.com
Hoisington Investment Management – Quarterly Review and Outlook, Second Quarter 2013
By Lacy Hunt, PhD, and Van Hoisington
Lower Long Term Rates
The secular low in bond yields has yet to be recorded. This assessment for a continuing pattern of lower yields in the quarters ahead is clearly a minority view, as the recent selling of all types of bond products attest. The rise in long term yields over the last several months was accelerated by the recent Federal Reserve announcement that it would be “tapering” its purchases of Treasury and mortgage-backed securities. This has convinced many bond market participants that the low in long rates is in the past. The Treasury bond market’s short term fluctuations are a function of many factors, but its primary and most fundamental determinate is attitudes toward current and future inflation. From that perspective, the outlook for long term Treasury yields to fall is most favorable in light of: a) diminished inflation pressures; b) slowing GDP growth; c) weakening consumer fundamentals; and d) anti-growth monetary and fiscal policies.
Inflation
Sustained higher inflation is, and has always been, a prerequisite for sustained increases in long term interest rates. Inflation’s role in determining the level of long term rates was quantified by Irving Fisher 83 years ago (Theory of Interest, 1930) with the Fisher equation. It states that long term rates are the sum of inflation expectations and the real rate. This proposition has been reconfirmed in numerous sophisticated statistical studies and can also be empirically observed by comparing the Treasury bond yield to the inflation rate (Chart 1). On an annual basis, the Treasury bond yield and the inflation rate have moved in the same direction in 80% of the years since 1954.
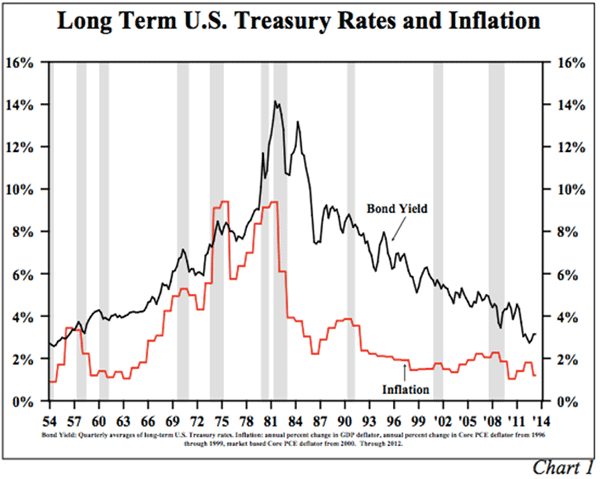
Presently the inflation picture is most favorable to bond yields. The year-over-year change in the core personal consumption expenditures deflator, an indicator to which the Fed pays close attention, stands at a record low for the entire five plus decades of the series (Chart 2).
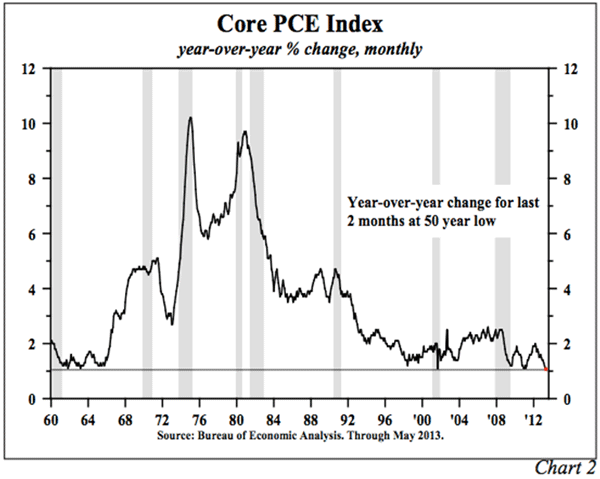
Additional factors restraining inflation are the appreciation of the dollar and the decline in commodity prices. The dollar is currently up 14% from its 2011 lows. A rise in the value of the dollar causes a “collapsing umbrella” effect on prices. A higher dollar leads to reduced prices of imports, which have been deflating at a 1% rate (ex-fuel) over the past year. When importers cut prices, domestic producers are forced to follow. Commodity prices have dropped more than 20% from their peak in 2011. This drop in commodity prices has also contributed to lower rates inflation.
Sustained higher inflation is not currently evident, and the forces that create inflation are absent. Thus, a period of sustained higher long term rates is improbable.
GDP
GDP growth, whether if measured in nominal or real terms, is the slowest of any expansion since 1948. From the first quarter of 2012 through the first quarter of 2013, nominal GDP grew at 3.3%. This is below the level of every entry point of economic contraction since 1948 (Chart 3). Real GDP shows a similar pattern. For the past four quarters real economic growth was just 1.6%, which was even less than the 1.8% growth rate in the 2000s and dramatically less than the 3.8% average growth rate in the past 223 years. These results demonstrate chronic long term economic underperformance.
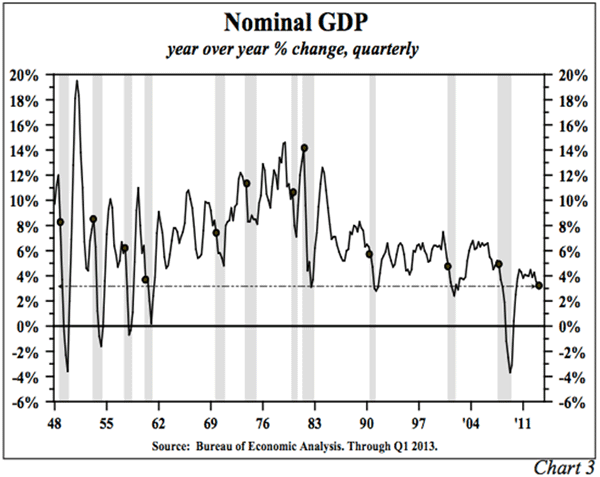
Over the past year, the Treasury bond yield rose as the nominal growth in GDP slowed. The difference between the Treasury bond yield and the nominal GDP growth rate (Chart 4) is important in two respects. First, when the bond yield rises more rapidly than the GDP growth rate, monetary conditions are a restraint on economic growth. This condition occurred prior to all the recessions since the 1950s, as indicated in the chart. This condition also signaled the growth recessions in 1962 and 1966-67. Second, the nominal GDP growth rate represents the yield on the total economy, a return that embodies greater risk than a 30 year Treasury bond. Thus, the differential is a barometer of cyclical value for investors in Treasury bonds versus more risky assets.
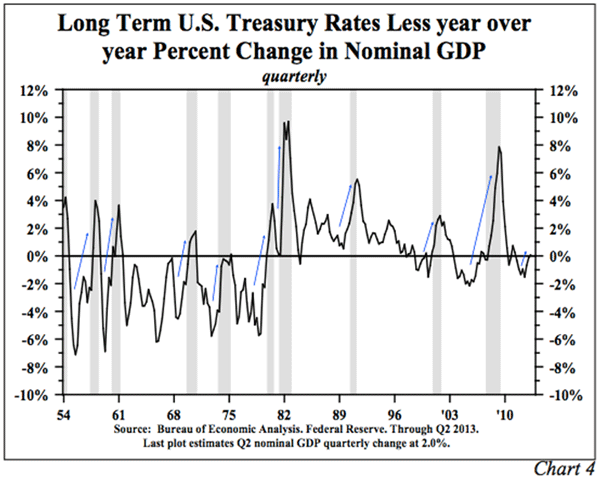
On two occasions in the 1990s the Treasury bond/GDP differential rose sharply. Neither a quasi- nor outright recession ensued, but in both cases bonds turned in a stellar performance over the next year or longer. This economic indicator simultaneously casts doubt on the prevailing pessimism on Treasury bonds and the optimism over U.S. economic growth.
Consumer
Consumers have not yet healed from the great recession. Their income and employment situations have languished. Based on the standard of living, as measured by the real median household income, this entire recovery has bypassed the consumer sector. The standard of living has contracted regularly in recessions, but this is the first time deep into an expansion that it has continued to erode. The current standard of living is unchanged from 1995 (Chart 5).
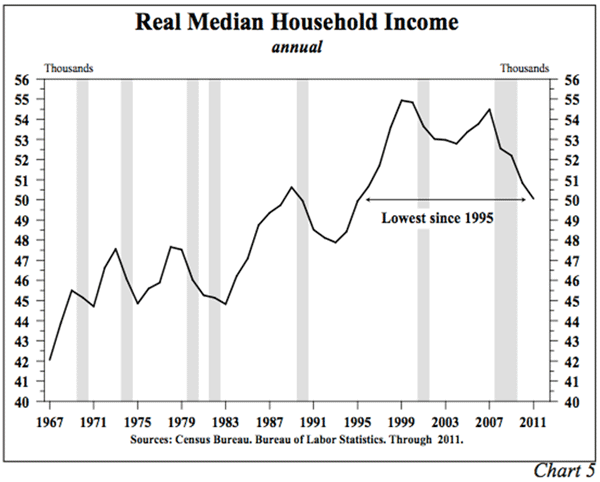
In spite of job gains in the first half of 2013, the downward pressure on the standard of living actually intensified. Approximately three quarters of the increases in jobs were in four of the lowest paying industries – retail trade; the temporary help services component of professional and business services; hospitality and leisure; and the nursing and residential care facilities component of the medical category. These increases may reflect efforts of firms to minimize the increase in health care costs associated with full time employment under the Affordable Care Act. Part time jobs averaged increases of 93,000 per month in the first half of 2013, while full time jobs averaged increases of only 22,000 per month. Full time employment as a percentage of the adult population is currently 47%, which is near the lows of the last three decades.
Historically, when taxes are increased, the initial response of households results in a lower saving rate rather than an immediate reduction in spending. For some consumers, recognition of the tax changes in their income is a problem, particularly for those whose earnings are dependent on commissions, bonuses or seasonal work. This explains the sharp drop in the personal saving rate to 2.7% in the first five months of this year, a level at or below the entry points of all the economic contractions since 1929. The 2013 slump in the saving rate is a precursor of the painful adjustments that lie ahead, and an additional restraint on economic growth. (Note: In late July the Bureau of Economic Analysis is expected to release a benchmark revision to the National Income and Product Accounts. As a result of the revision the personal saving rate may be raised by up to 1.5%. This is due to the change in consumer ownership of defined benefit pension plans. This revision will not change the trend of the saving rate, nor will this higher figure indicate a source of funds for immediate spending since consumers will only receive such pension benefits when they retire.)
The drop in the saving rate in 2013 also serves to explain why the primary drain from higher taxes occurs with a lag after the taxes take effect. Based on various academic studies there is a two or three quarter lag in curtailed spending after the tax increase. Thus, the main drag on growth will fall in the third and fourth quarters of this year, with negative residual influences persisting through the end of 2015. Approximately $140 billion of the tax increase constitutes what might be termed a reduction in permanent income, or its equivalent life cycle income. In addition to working with a lag, over a three year period this portion will carry a negative multiplier of between two and three.
Monetary & Fiscal
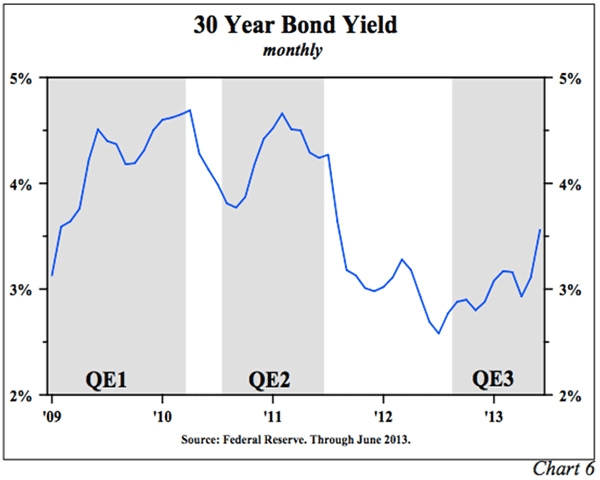
Astronomical sums of money have been expended by both monetary and fiscal authorities since the crisis. With the benefit of hindsight it is clear their efforts have not aided economic growth, but rather the balance of their actions has been counter productive. The Fed has maintained the Fed Funds rate at near-zero levels, and it has tried to lower longer term rates through a series of quantitative easings. The effect of each of the quantitative easings was the opposite of the Fed’s intentions. During every period of balance sheet expansion long rates rose, yet when securities purchases were discontinued yields fell (Chart 6). The Fed cannot control long rates because long rates are affected by inflation expectations, not by supply and demand in the market place. This is extremely counter intuitive. With more buying, one would assume that prices would rise and thus yields would fall, but the opposite occurred. Why? When the Fed buys, it appears that the existing owners of Treasuries (now amounting to $9.5 trillion) decide that the Fed’s actions are inflationary and sell their holdings, raising interest rates. When the Fed stops this program, inflation expectations fall creating a demand for Treasuries, bringing rates back down. The Fed’s quantitative policies have been counter productive to growth as interest rates have risen during each period of quantitative easing. During QE1 and QE2, commodity prices rose, the dollar fell and inflation rose temporarily. Wages, however, did not respond. Thus, the higher interest rates during all QEs and the fall in the real wage income during QE 1 & 2 served to worsen the income and wealth divide. This means many more households were hurt, rather than helped, by the Fed’s efforts.
In terms of government spending, fiscal policy has not, and will not, have a major affect on economic growth. The increased spending immediately following the financial crisis did little to encourage the economy to grow faster. Likewise, the decrease in spending associated with the “sequester” will unlikely be a drag on growth after the initial and lagged effects are fully exhausted. The research on government spending multipliers suggests that the multiplier on spending is very close to zero.
The impact of tax changes is not nearly as harmless. It has been argued that an expired “temporary payroll tax cut” would not effect spending as the initial increase in income was not seen as permanent. The facts seem to counter this opinion. The average monthly year-over-year growth rate of real personal income less transfer payments for 2011 was 3.4%, and in 2012 it was 2.2%. This year, with the payroll tax change in effect, the average is 1.8% through May. The slower income has resulted in a slowdown in spending. Like income, real personal consumption expenditures has trended lower, with average monthly year-over-year growth rates of 2.5% for 2011, 1.9% for 2012 and 1.8% through May of this year. This trend is expected to continue for some time.
A Final Consideration Favoring Bonds
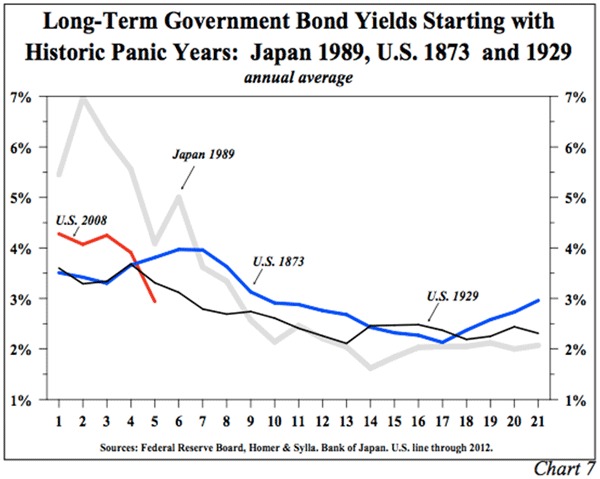
In the aftermath of the debt induced panic years of 1873 and 1929 in the U.S. and 1989 in Japan, the long term government bond yield dropped to 2% between 13 and 14 years after the panic. The U.S. Treasury bond yield is tracking those previous experiences (Chart 7). Thus, the historical record also suggests that the secular low in long term rates is in the future.
Like Outside the Box?
Sign up today and get each new issue delivered free to your inbox.
It's your opportunity to get the news John Mauldin thinks matters most to your finances.
© 2013 Mauldin Economics. All Rights Reserved.
Outside the Box is a free weekly economic e-letter by best-selling author and renowned financial expert, John Mauldin. You can learn more and get your free subscription by visiting www.MauldinEconomics.com.
Please write to subscribers@mauldineconomics.com to inform us of any reproductions, including when and where copy will be reproduced. You must keep the letter intact, from introduction to disclaimers. If you would like to quote brief portions only, please reference www.MauldinEconomics.com.
To subscribe to John Mauldin's e-letter, please click here: http://www.mauldineconomics.com/go/bwYeg/
To change your email address, please click here: http://www.mauldineconomics.com/change-address
Outside the Box and MauldinEconomics.com is not an offering for any investment. It represents only the opinions of John Mauldin and those that he interviews. Any views expressed are provided for information purposes only and should not be construed in any way as an offer, an endorsement, or inducement to invest and is not in any way a testimony of, or associated with, Mauldin's other firms. John Mauldin is the Chairman of Mauldin Economics, LLC. He also is the President of Millennium Wave Advisors, LLC (MWA) which is an investment advisory firm registered with multiple states, President and registered representative of Millennium Wave Securities, LLC, (MWS) member FINRA, SIPC, through which securities may be offered . MWS is also a Commodity Pool Operator (CPO) and a Commodity Trading Advisor (CTA) registered with the CFTC, as well as an Introducing Broker (IB) and NFA Member. Millennium Wave Investments is a dba of MWA LLC and MWS LLC. This message may contain information that is confidential or privileged and is intended only for the individual or entity named above and does not constitute an offer for or advice about any alternative investment product. Such advice can only be made when accompanied by a prospectus or similar offering document. Past performance is not indicative of future performance. Please make sure to review important disclosures at the end of each article. Mauldin companies may have a marketing relationship with products and services mentioned in this letter for a fee.
Note: Joining The Mauldin Circle is not an offering for any investment. It represents only the opinions of John Mauldin and Millennium Wave Investments. It is intended solely for investors who have registered with Millennium Wave Investments and its partners at www.MauldinCircle.com (formerly AccreditedInvestor.ws) or directly related websites. The Mauldin Circle may send out material that is provided on a confidential basis, and subscribers to the Mauldin Circle are not to send this letter to anyone other than their professional investment counselors. Investors should discuss any investment with their personal investment counsel. You are advised to discuss with your financial advisers your investment options and whether any investment is suitable for your specific needs prior to making any investments. John Mauldin is the President of Millennium Wave Advisors, LLC (MWA), which is an investment advisory firm registered with multiple states. John Mauldin is a registered representative of Millennium Wave Securities, LLC, (MWS), an FINRA registered broker-dealer. MWS is also a Commodity Pool Operator (CPO) and a Commodity Trading Advisor (CTA) registered with the CFTC, as well as an Introducing Broker (IB). Millennium Wave Investments is a dba of MWA LLC and MWS LLC. Millennium Wave Investments cooperates in the consulting on and marketing of private and non-private investment offerings with other independent firms such as Altegris Investments; Capital Management Group; Absolute Return Partners, LLP; Fynn Capital; Nicola Wealth Management; and Plexus Asset Management. Investment offerings recommended by Mauldin may pay a portion of their fees to these independent firms, who will share 1/3 of those fees with MWS and thus with Mauldin. Any views expressed herein are provided for information purposes only and should not be construed in any way as an offer, an endorsement, or inducement to invest with any CTA, fund, or program mentioned here or elsewhere. Before seeking any advisor's services or making an investment in a fund, investors must read and examine thoroughly the respective disclosure document or offering memorandum. Since these firms and Mauldin receive fees from the funds they recommend/market, they only recommend/market products with which they have been able to negotiate fee arrangements.
PAST RESULTS ARE NOT INDICATIVE OF FUTURE RESULTS. THERE IS RISK OF LOSS AS WELL AS THE OPPORTUNITY FOR GAIN WHEN INVESTING IN MANAGED FUNDS. WHEN CONSIDERING ALTERNATIVE INVESTMENTS, INCLUDING HEDGE FUNDS, YOU SHOULD CONSIDER VARIOUS RISKS INCLUDING THE FACT THAT SOME PRODUCTS: OFTEN ENGAGE IN LEVERAGING AND OTHER SPECULATIVE INVESTMENT PRACTICES THAT MAY INCREASE THE RISK OF INVESTMENT LOSS, CAN BE ILLIQUID, ARE NOT REQUIRED TO PROVIDE PERIODIC PRICING OR VALUATION INFORMATION TO INVESTORS, MAY INVOLVE COMPLEX TAX STRUCTURES AND DELAYS IN DISTRIBUTING IMPORTANT TAX INFORMATION, ARE NOT SUBJECT TO THE SAME REGULATORY REQUIREMENTS AS MUTUAL FUNDS, OFTEN CHARGE HIGH FEES, AND IN MANY CASES THE UNDERLYING INVESTMENTS ARE NOT TRANSPARENT AND ARE KNOWN ONLY TO THE INVESTMENT MANAGER. Alternative investment performance can be volatile. An investor could lose all or a substantial amount of his or her investment. Often, alternative investment fund and account managers have total trading authority over their funds or accounts; the use of a single advisor applying generally similar trading programs could mean lack of diversification and, consequently, higher risk. There is often no secondary market for an investor’s interest in alternative investments, and none is expected to develop.
All material presented herein is believed to be reliable but we cannot attest to its accuracy. Opinions expressed in these reports may change without prior notice. John Mauldin and/or the staffs may or may not have investments in any funds cited above as well as economic interest. John Mauldin can be reached at 800-829-7273.
