
The Rules Have Changed

Monetary policy is a balancing act. The Federal Reserve’s “dual mandate” requires it to promote both maximum employment and stable prices. Statutorily, neither is more important than the other. The Fed is supposed to seek both at the same time.
Monetary policy is a balancing act. The Federal Reserve’s “dual mandate” requires it to promote both maximum employment and stable prices. Statutorily, neither is more important than the other. The Fed is supposed to seek both at the same time.
Of course, there are those of us across the spectrum who think one or the other mandate should have priority. And let’s not even get into the “third priority” that the Fed seems to have taken on itself which is the market.
In practice, achieving the dual mandate is hard because the goals work against each other. If employment is truly maximized, there isn’t a large pool of idle workers, especially with the right skills. Employers would have to compete against each other by raising wages, which will eventually raise prices. Similarly, if prices are truly stable, when businesses innovate and figure out how to actually reduce prices (which is what happens with free markets and creative destruction), with the same amount of employment costs, then inflation goes down and for some reason central bankers seem to worry about inflation getting too low or even dropping into deflation. (That’s a whole different letter.)
As a result, Fed policy more typically focuses on one side of the mandate, then swings the opposite way when the goal seems achieved. Hence, the “punchbowl” analogy I described last week. Need more employment? Fill the punchbowl. Then drain it when inflation picks up.
We are right now in one of those punchbowl transitional periods. It actually dates back to last year when the Fed started cutting rates then paused a few months later when inflation data suggested they were refilling the punchbowl too soon. But with unemployment still rising, they’ve decided to swing the other way again.
Fed officials have to drive the car forward while looking only in the rearview mirror. Worse, the mirror is foggy. Inflation can be regional, in addition to personal, and trying to find one-size-fits-all solutions for a country of 330 million people is beyond problematic. The employment data has methodology problems. Even if the numbers are right, their meaning may be different now. Demographic changes and new technologies like AI are changing the nature of work.
Today we will review some of the latest jobs data, trying to figure out what it means in a larger context. But first, I want to think about the whole concept of “work.”
Broken Circle
On a purely economic basis, in all but the poorest countries, our jobs are the way we make the money to sustain ourselves. It was a giant step forward from the time when almost everyone lived in family groups or small clans, producing their own food. Now we (at least in the developed world) learn skills and sell them to others. This lets us earn income and then buy what we need.
Yet as society advanced, jobs became much more than income. Work evolved into a source of self-worth, as opposed to “mere” survival. It also became a social institution where people would make friends and even find mates. This improved their lives and made them even more productive in a classic “virtuous circle.”
The downside: Losing a job, or not being able to find one, became devastating not just financially but also socially. This bled into politics. “Jobs, jobs, jobs” became a policy mantra as elected leaders saw how high unemployment could quickly cost them their jobs. That’s one reason the Fed was tasked with the full employment mandate in the 1978 Humphrey-Hawkins Full Employment Act. Those of us who lived through the ’70s know how precarious employment was back then.
As technology progressed, jobs evolved from manual labor to office work and other more cognitive tasks. Yet work remained key to our social lives as well as our incomes. And something important seems to have changed in the last few years: People are losing faith that their work will deliver the benefits it used to.
Or what they think the benefits were at one time. What they, and especially younger people, can see is that their parents and grandparents seem to be relatively prosperous (they own their homes, etc.) and they can’t see a path where they can achieve the same relative benefits.
A new Wall Street Journal-NORC poll found that only 25% of Americans think they have a good chance of improving their living standard. Nearly 70% said they believe the American dream—the idea that if you work hard, you will get ahead—no longer holds true or never did. Note that the big gap down began after Covid and after the largest fiscal and monetary stimulus in history. Something changed, at a minimum in the psychology of the country, and I believe in the reality brought on by decades of improper monetary policy which created a great wealth and income divide.

You can see in the chart a big drop following the COVID period, but a general downward trend even earlier. As recently as 2000, more than 75% agreed they had a good chance to get ahead. Now only 25% do, and that’s down from last year’s survey.
Something has gone deeply wrong in this century and it’s getting worse. The discontent is widespread, cutting across all kinds of lines. From WSJ:
“By large majorities, both women and men held a pessimistic view in the combined questions. So did both younger and older adults, those with and without a college degree and respondents with more than $100,000 in household income, as well as those with less.
“’It sort of saddens me,’ said Neale Mahoney, a Stanford University economics professor who has studied economic sentiment. ‘I think one of our superpowers as a country is our relentless optimism… It is the fuel for entrepreneurship and other exceptional achievements.’
“The poll found a somewhat brightening view of the current economy. Some 44% rated the economy as excellent or good, up from 38% a year ago, though still a smaller share than the 56% who now view the economy as not good or poor.
“And yet many people in the survey, as well as in interviews, said they felt a sense of economic fragility, even if their finances were adequate or secure today. In a generational cascade, majorities said the prior generation had an easier time buying a home, starting a business or being a full-time parent rather than in the workforce, while majorities also said they lacked confidence that the next generation could buy a home or save adequately for retirement.”
If you don’t believe a job will help you get ahead, and especially if you have access to income from either government or family, the motivation to seek one diminishes. Various government benefits allow some people to “retire,” even at what might be thought of as prime working years. It may not be coincidental that the percentage of people participating in the labor force has fallen considerably since 2000.

“Participating” means you are either employed or are looking for work. Participation did increase beginning in the 1960s as previously all-male occupations opened up to women, and frankly businesses needed more workers as the economy expanded. And some of the post-2000 decline is due to the general population aging. But that’s not all, by any means.
Here’s the same data for ages 25–54, the “prime age” group that is usually out of school but not yet retired.

Participation in this group also peaked around 2000, fell until 2015, recovered, fell again during the pandemic, then recovered again. Another setback might easily push it down once more.
We really have two employment challenges. Providing an adequate number of jobs at adequate wages is only the first part. We also need the labor force to believe that having a job will make their lives better than the alternatives like relying on crime, family, friends, and/or government aid.
“Something Is Different Now”
With that backdrop, let’s look at the current data. Below is a long-term chart of the headline unemployment rate. It contains an anomaly I only recently noticed. Direct your attention to the red circle and compare it to the past.

The US economy has been through many cycles since 1948 in which unemployment spiked. The key word is “spiked.” When the jobless rate rises, it rises quickly. Or at least it used to. Now it’s taken almost 2½ years to increase less than one percentage point, from 3.4% to 4.3%.
This kind of slow uphill climb hasn’t happened before. Whatever the cause or causes, it’s a clue that something is different now. As we say with stocks, past employment data is not necessarily indicative of future employment data.
Now let’s zoom in on the last year, using a chart David Bahnsen recently showed at his presentation in Houston (it was a tour de force—if you ever get a chance to hear him live then do so!). It shows monthly net job creation, which varies a lot and is becoming subject to large revisions as employers report their data more slowly. That’s not great but this is what we have.

The red-circled part shows sharply lower job creation starting in May. The September report could revise the July and August bars even lower, too. What’s happening?
The new import tariffs are surely a partial factor. President Trump’s April announcement and subsequent developments, like them or not, created uncertainty for many businesses. Hiring and investment plans went on hold. Maybe they’ll come back, but at least for the moment, job creation is down.
On the plus side, we aren’t seeing large-scale layoffs. Employers have slowed their hiring but aren’t reducing headcount except by attrition. That’s good news for people who have jobs, but terrible for those who don’t. Finding a spot is tough, so the number of unemployed people is slowly climbing. It’s now above the number of job openings, as you can see in this Torsten Sløk chart.

The monthly BLS surveys ask how long people have been unemployed. The average was around 20 weeks when the unemployment rate bottomed out in 2023. As of August, it was 24.5 weeks. This suggests job searches are taking roughly a month longer than they were in a very strong labor market.

If 24.5 weeks is the average, then some people—perhaps millions—have been unemployed even longer. We know from other data that 6+ months without income will devastate most people. This no doubt contributes to the general sense of discouragement pollsters are finding.
One reason may be that the small amount of job creation we are currently seeing is increasingly concentrated. The bars in the chart below represent the yearly average change in private-sector jobs by sector. The red is healthcare; the gray is everything else.

Healthcare—which while nominally “private” depends heavily on government funding—represented half or more of net job creation in 2023 and 2024. This year so far, it’s become almost the only job-creating game in town—bad news for job seekers who lack the skills or credentials needed for healthcare work.
Old Rules
The “dot plots” from this week’s FOMC meeting show the median committee member expects the unemployment rate will rise to 4.5% by year-end, then decline slowly to 4.2% by 2028. Their longer-run estimates range from 3.8% to 4.5%.
In other words, even the most pessimistic FOMC members don’t foresee unemployment rising a great deal from the current 4.3%. Yet they still cut their policy rate by a quarter point and signaled an intent to cut more.
The FOMC statement directly links rate cuts with “downside risks to employment.” They seem to think lower rates will reduce this risk. My question is how? What is the chain of cause and effect?
In theory, lower rates stimulate aggregate demand, which spurs job creation as producers try to fill the demand. But consumer spending is actually quite strong, as you would expect in an economy with a relatively low unemployment rate and a stock market near new all-time highs.
Lower rates have other effects, too. For one, they reduce the income of retirees who are living off bond and money market interest. Cutting rates won’t stimulate their demand for goods and services. I really don’t see how the action the Fed is taking will contribute to the Fed’s stated goal.
When the Fed took rates to the zero bound in the 2010s, the economy was barely growing at 2%. Low rates did not drive GDP higher. It was financial repression of savers and retirees, who couldn’t spend interest income they didn’t get. But evidently since that isn’t in the Fed model, they ignore it.
Sidebar: I think it is more useful to think about GDP in per capita terms. And there the picture is not as robust. GDP growth since 2000 has averaged 1.4% in per capita terms:
But again, I’m thinking of this under the old rules. Growing evidence says the rules have changed.
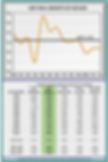
The chart below comes from the WSJ survey I described above. The darker line is the Michigan consumer sentiment survey. The lighter one is a simple model that uses the unemployment rate, inflation, consumer spending, and stock market performance to predict how consumers “should” feel given the historical correlations between all those.
As you can see, the model did a pretty good job from 2006 until 2020. Sentiment was predictable for each month’s prevailing conditions. But then it broke.

In 2021, actual sentiment went the opposite direction from where the model’s prediction said it should. The gap widened even more this year. Consumers are far more pessimistic now than they were under similar conditions pre-2020.
The Fed is acting based on the belief that lower rates will change consumer behavior like it did in the past. But the evidence says consumer attitudes have changed radically in the last five years.
Now, you could argue that consumers are telling pollsters one thing while continuing to spend freely. That’s probably true for some consumers, particularly those near the top who account for a growing share of the total. It is certainly not true for the 7.3 million unemployed workers, or many more millions more who are underemployed.
The future, particularly in the mind of the average American, is more uncertain than ever. So is Fed policy. One strong employment report or a higher inflation report could easily make the FOMC pause. I thought it was significant that dovish Fed governors Chris Waller and Michelle Bowman didn’t join new governor Stephen Miran in pushing for a 50-basis-point cut. They got the initial cut they wanted; maybe they’re back in data-dependent mode. Time, and a few speeches, will tell.
I am growing more and more convinced that we simply can’t rely on historical precedents anymore. Economics is about human decisions, and humans, at least in a broad sense, seem to be making decisions differently than they did before the pandemic. I think we don’t fully understand how much has changed—for employment, inflation, consumer behavior, and more.
This level of anxiety plays out into every aspect of society. If you are anxious about the future and have been taught in school that capitalism has serious flaws; if you are concerned about your future; if you see the wealth and income disparity; it becomes easier to advocate for a more socialist society where government takes responsibility rather than free markets. This of course will produce tensions in the political realm.
This all feeds into what I feel is the coming crisis, The Great Reset, a combination of Neil Howe’s The Fourth Turning, Peter Turchin’s overproduction of elites, George Friedman’s prediction of global conflict, Ray Dalio’s business and economic cycles, and my own view of the precipitating crisis of not just US but global sovereign debt which will trigger The Great Reset.
If we don’t understand what is happening, it’s hard to do anything about it. I don’t envy the FOMC members. They’re making enormously consequential decisions while partially blinded. We should all hope they somehow make good ones.
Atlanta, Cleveland, Tulsa, and Stetson
I will be in Atlanta with Dr. Mike Roizen for one night in early October (right after my 76th birthday October 4th) looking at a location for another longevity clinic. Sometime later in October I will have to go to Cleveland Clinic for 3–4 days for what is called a minor procedure. Of course, when someone is messing with your private parts it never seems particularly minor, at least to me. Then nothing else is scheduled until Thanksgiving where Shane and I end up in Tulsa where all the family will gather at my daughter Amanda and her husband Allen’s house. It would be nice if my 10th grandchild is born a few days early while I am still in the region. The father is Shane’s son, Dakota, so Shane is likely to hang around. I am told they will name him Stetson.
This last week was special. I got to be with so many friends in Austin. I attended a full Shabbat dinner last Friday, with 20 family members, and more than ½ dozen kids under seven. It was actually very moving to me personally, as I remember the times with my seven kids and their friends and family sitting around the table, which now seems so long ago. It is one of the reasons that Thanksgiving is so important to me. But it also drove home to me that there were a million homes around the world experiencing that same ritual.
It is shared experiences that drive and cement a culture. An afternoon of baseball or an evening of football, dinners with friends, time together, church, family, our work, and all the things in our lives that connect us. In these contentious times, I believe that the things that connect us are going to be more important to us than ever.
I so enjoyed getting to hear Mike Roizen talk yet again about longevity last Monday night in Dallas to a nice-sized dinner group. I had so many friends there, several of whom reminded me of a 2016 election party in my condo in Dallas, with 120 people from around the world. Or the times we spent in my office at the Ballpark in Arlington when my office was there. Shared experiences. Getting to be with David Bahnsen and friends in Houston was a great way to end the week.
All these things feed my soul. Just like writing this letter to you. When I am out with my readers, as I have been this past week, I can feel that connection. And I try to bring it to you each week. Thanks ever so much for your attention and being willing to be part of my online family. I am truly grateful.
And with that, I will hit the send button. You have a great week and let’s all find more ways to connect! And don’t forget to follow me on X!
Your still feeling the adventure of life analyst,

John Mauldin
P.S. If you like my letters, you'll love reading Over My Shoulder with serious economic analysis from my global network, at a surprisingly affordable price. Click here to learn more.
Read important disclosures here.
YOUR USE OF THESE MATERIALS IS SUBJECT TO THE TERMS OF THESE DISCLOSURES.
Put Mauldin Economics to work in your portfolio. Your financial journey is unique, and so are your needs. That's why we suggest the following options to suit your preferences:
-
John’s curated thoughts: John Mauldin and editor Patrick Watson share the best research notes and reports of the week, along with a summary of key takeaways. In a world awash with information, John and Patrick help you find the most important insights of the week, from our network of economists and analysts. Read by over 7,500 members. See the full details here.
-
Invest in longevity: Transformative Age delivers proven ways to extend your healthy lifespan, and helps you invest in the world’s most cutting-edge health and biotech companies. See more here.
-
Macro investing: Our flagship investment research service is led by Mauldin Economics partner Ed D’Agostino. His thematic approach to investing gives you a portfolio that will benefit from the economy’s most exciting trends—before they are well known. Go here to learn more about Macro Advantage.

Thoughts from the Frontline
Follow John Mauldin as he uncovers the truth behind, and beyond, the financial headlines. This in-depth weekly dispatch helps you understand what's happening in the economy and navigate the markets with confidence.
Let the master guide you through this new decade of living dangerously
John Mauldin's Thoughts from the Frontline
Free in your inbox every Saturday
By opting in you are also consenting to receive Mauldin Economics' marketing emails. You can opt-out from these at any time. Privacy Policy