
Soft Data Hardens
-
 John Mauldin
- |
- August 8, 2025
- |
- Comments
- |
- View PDF
 John Mauldin
I remember when August was a slow month. School didn’t start until after Labor Day. Even in my adult days in the investment world, not much happened. People were either on vacation or coming back and getting ready for September. It’s hard to believe, but nobody really cared about Jackson Hole in the ’80s or ’90s. And it had several venues up until 1981 when it became “Jackson Hole.”
This August, and even this week, has been quite the exception to that old rule. Since 2022 we’ve been feeling recession “vibes” even as labor data and other hard indicators showed nothing of the sort. Only in mid-2024 did Fed officials finally decide growth was a bigger risk than unemployment and start cutting rates. Then they changed their minds within a few months, saying the fight against inflation was again more important.
This year started with many economists saying President Trump’s tariffs would surely set off a recession. I admit I was concerned, but in this economic environment you simply can’t use the word surely. The hard data kept saying otherwise… until last week when it suddenly didn’t. A weak July jobs report got the most attention, but other hard data softened, too.
Now traders think a September rate cut is back on the Fed’s agenda. The surrounding talk is the same, but should we trust the data?
That’s an important question because the data is our economic “instrument panel.” Without it, we’re flying blind… or dependent on vibes. And running an investment portfolio or business or your personal life on vibes is difficult. But if that’s all we have?
Planning Purposes
Almost everything we think we know about the economy comes from initially flawed data. Jobs data, inflation data, spending data, production data, all of it is imperfect. There is no certainty in this business. But that doesn’t make the data useless.
I’ve told the story before about Nobel-winning economist Kenneth Arrow’s experience as a World War II weather officer. His team was assigned to produce long-range weather forecasts. They tried every method they could imagine. None were any better than flipping coins.
Frustrated, Arrow and his team asked to be relieved of this pointless duty. They received this response:
“The Commanding General is well aware that the forecasts are no good. However, he needs them for planning purposes.”
What does that mean? Weather affects war plans. If planes can’t fly or ships can’t sail, a plan that depends on them doing so isn’t going to work. But generals don’t need certainty; a range of possibilities is enough. It lets their plans account for known contingencies.
Similarly, the data that goes into our economic forecasts is never 100% reliable, but it doesn’t have to be. We just need to identify turning points so we can adjust our strategies.
All that said, we also want our data to be as reliable as possible. Careless and/or biased methods don’t help. Nor does the perception that data may be manipulated for political purposes.
The best defense against such problems is to have a consistent and transparent data collection process. With that, we can have enough confidence in the data to make it useful, though still imperfect. Like Kenneth Arrow was told, it’s close enough “for planning purposes.”
Last week’s unexpectedly weak jobs report led President Trump to denounce and fire BLS Commissioner Erika McEntarfer. His main concern seemed to be revisions to prior months which imply unemployment has been much worse than it initially appeared.
Let’s try to cut through what happened here. Whether or not big negative revisions are evidence of political bias, they were happening long before Trump began his second term. Bear with me here as we take three different looks at the problem.
First, with the exception of COVID, these revisions do look large over the last 10 years.
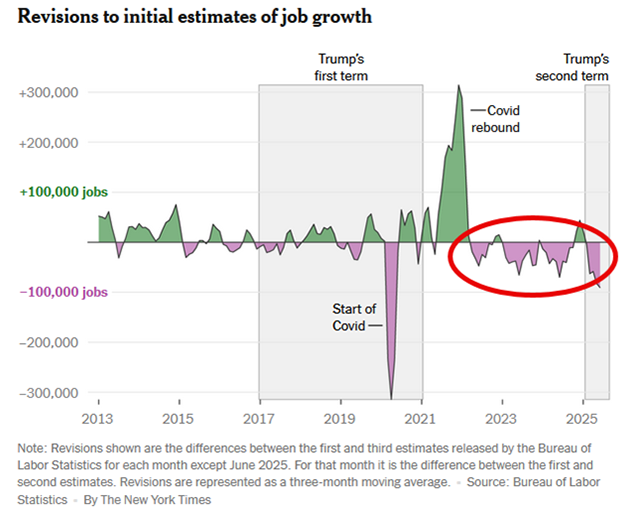
Source: The New York Times
You can see in the red circle how the revisions became mostly negative in 2022, a pattern that continued into this year.
Like what you're reading?
Get this free newsletter in your inbox every Saturday! Read our privacy policy here.
But let’s look back further. Going back to 2000, we see a great deal of volatility, especially in the 2000s. Note: There were much larger negative jobs revisions around the Great Recession—but also larger and more frequent positive revisions.
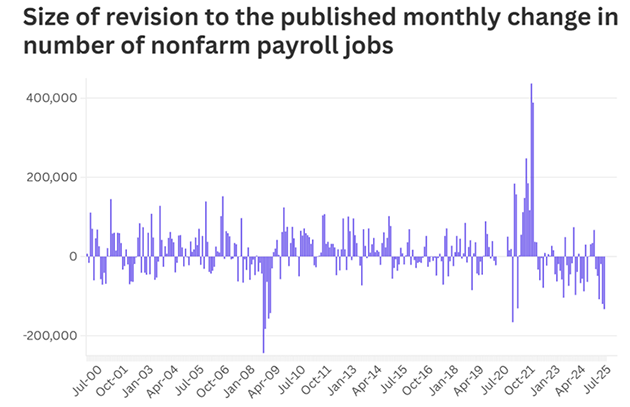
Source: APM Research Lab
What if we go back to 1979 to the very beginning? We see a lot of volatility but also the moving average is generally positive except for a period in the 1980s.
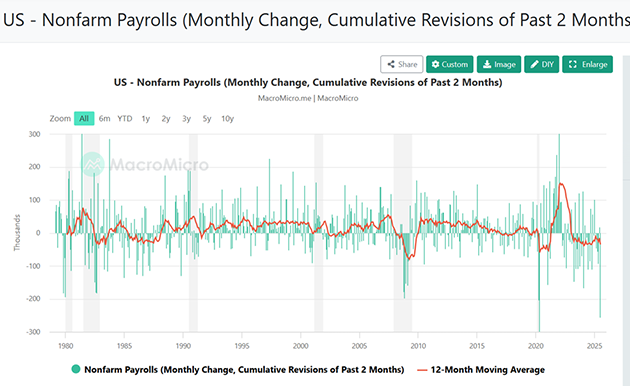
Source: MacroMicro
There is indeed a problem with the employment data, but not necessarily the kind that can be solved by firing people. The real problem is much bigger than BLS. Survey data of all kinds isn’t working like it used to because people are increasingly reluctant to answer survey questions. This is happening in both government and private surveys.
By the way, the nonfarm payroll data is more important than you might think. It feeds into the data for gross domestic income. The number of employees, hours worked, and hourly earnings are used to estimate the overall wage and salary income generated in the economy. That means we can see revisions and other data points.
Survey data works by questioning a random sample of a population. To be accurate, it needs a high percentage of the sample to respond. These percentages declined considerably since 2020. Dave Rosenberg explained it well.
“The issue is with the post-COVID plunge in the business ‘response rate.’ This is not about the BLS, which is forced to deal with the data that companies send in with respect to the initial release.
“It seems completely lost in this discussion that the root of the problem is the historically low company response rate to the first round of the monthly survey—this is a survey that depends on business cooperation, and the reality is that the response rate does not approach anything that can be considered reliable until that second revision comes in. Maybe the BLS should simply stop publishing the payroll data so quickly—think of the first release as something no more than an incomplete snapshot of the labor market, because it is no easy task ‘to get it right’ in the days that follow a month in a market as complex and as large as a 170 million person labor force, not to mention all the churning that goes on beneath the surface. What we gain in speed of delivery of the data, we lose in veracity, given the naturally lower sample size once the response rate rises in the next two months.
|
“The one thing to consider is that it is an entire employment report, replete with a wealth of information beneath the headline, even if incomplete at first. But there is typically a high error term in the first go-around, especially since the pandemic, as a low share of 58% of businesses now get in their responses on time for the first payroll release. Pre-COVID, it was over 80% in terms of the response rate. By the time the third revision comes in, the response rate goes to 94%, where it’s mostly been in the past, and it is only then that the BLS truly has enough information collected for anyone to get an accurate portrayal of what the labor market really looked like in the month of the first release.
Share of Responses: First Preliminary Release (percent)
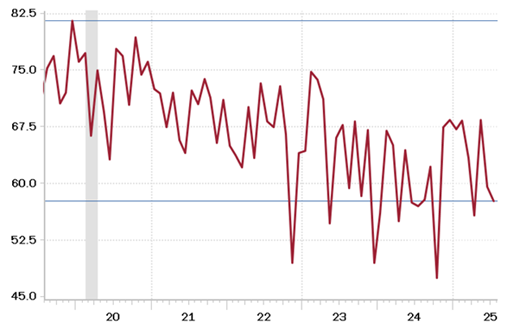
Share of Responses: Third Final Release (percent)
Source: Rosenberg Research
“It’s really something that people are only now paying attention to—the fact that first estimates get revised as more accurate information is received. This has been a fact of life… forever. Nobody was talking about it a month ago, funny enough [JM: Rosie, I was]. And there will be future benchmark revisions as even more information comes in. Everyone who follows the data closely knows that there is a high error term in the initial release of everything from payrolls to retail sales, to GDP. It is all written up each month in the detailed notes to the data releases.
“The price paid for receiving information quickly is the accuracy, as it pertains to the initial report. Nobody is amazed that we got the July data on the first day of August? And this number will get revised too, for sure. These are preliminary estimates with a large error term only because the sample size for the first stab at the employment report is so small. Why is everyone so shocked?”
Worse, the impact isn’t equal for all businesses. Large companies likely have a person or department assigned to answer government surveys. Small business owners, on the other hand, have their hands full. If they respond at all, it may take weeks.
That weights the initial data to larger, more stable companies. Those who have problems show up later in the revisions. This may be why the revisions have tilted downward as the economy weakens. The problem isn’t that the data is wrong. It’s just late.
If that’s the reason, it presents a serious challenge to policymakers. Delayed data means delayed response to whatever the data reveals.
BLS and other data-collecting agencies should be looking for better solutions. If they aren’t, then the president was right to rattle their cages. But to me, this looks more like bureaucratic inertia than political bias. Maybe a shakeup is due. We do live in an age of AI and lots of private data.
At the same time, we shouldn’t assume the people inside BLS and other agencies are not thinking about those issues. This is an extraordinarily complex process that is endlessly debated within small but passionate economic and statistical constituencies.
“A Stranger, Less Comfortable Future”
Assuming the latest data, including revisions, is more or less correct, job creation has slowed considerably in the last few months—not yet to recession levels but trending that way. What is going on?
First, let’s note a critical distinction. “Lack of job creation” isn’t the same as “job losses.” Generally speaking, we don’t see increased layoffs or firings. The issue is that employers have slowed or stopped new hiring.
One clue to this can be seen in the weekly unemployment benefit claims. They have spent the last three years within a range roughly between 200,000 and 250,000. The August 7 release showed 226,000, not far off expectations. If employers were seriously trying to reduce headcount, we would see it in this series. So far, we are not.
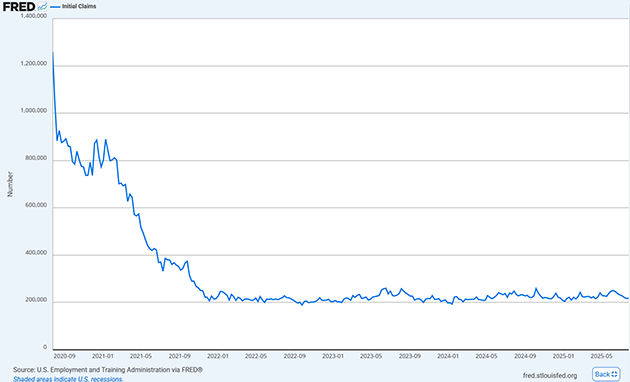
Source: FRED
However, unemployment benefits are for people who lose jobs. They don’t reflect those who are just entering the labor force—new college graduates who can’t find suitable positions, inflation-afflicted retirees who decide to start working again, etc. Those groups count as “unemployed” because they’re actively seeking work, but they aren’t eligible for unemployment benefits.
Going deeper, the small amount of new employment we see is highly concentrated in one part of the economy. This chart shows 6-month employment change by sector as of July.
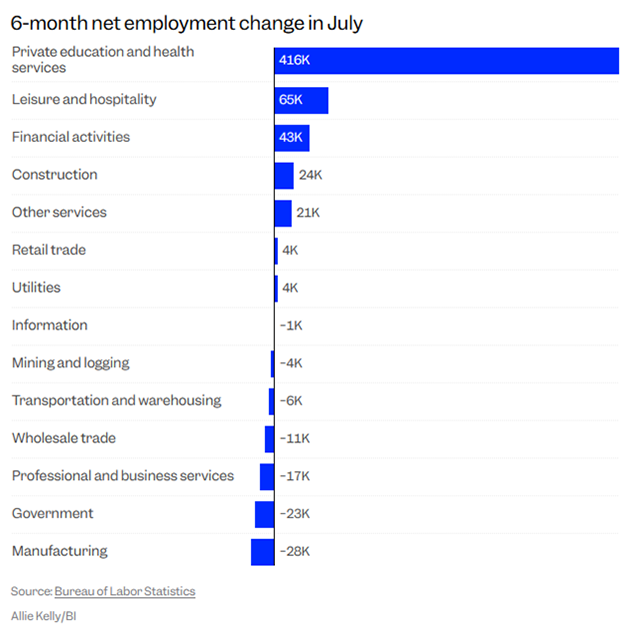
Source: Business Insider
The vast majority of job creation, almost all, appears to be in the “Private education and health care” category. That odd combination is just the way BLS categorizes them—another thing I hope they change. I’m sure healthcare hiring far outweighs education, especially eldercare. But in any case, both those sectors depend heavily on government support. Hiring tied to the business cycle is stagnant at best.
Like what you're reading?
Get this free newsletter in your inbox every Saturday! Read our privacy policy here.
Bloomberg’s Joe Weisenthal had this reaction (my emphasis in bold):
“So, if you just think about the current state of the US economy, there’s something vaguely futuristic about it. A very tiny handful of people are getting generationally wealthy (and powerful). A broad swathe of people is seeing their personal balance sheets improve because the stock market’s been so hot… And then the only areas of actual widespread jobs growth are tied to aging and health, much of which is sustained by widening deficit spending.
“What we’re not seeing is any kind of general expansion in activity across the economy.
“A bad jobs report here or there is not the end of the world. They happen from time to time, and people freak out, and then forget about it. However, the specific contours of this moment feel like a glimmer of a stranger, less comfortable future.”
We are indeed in a strange moment. Like Joe, I think some of it relates to demographics. The aging population raises healthcare demand, as he says, but is doing so at the same time the supply of working-age people shrinks. That explains why we aren’t seeing many layoffs and wages are still rising.
More than a few of us were predicting this a long time ago because we could see the numbers. Demographics is destiny is cliché, but true. We are getting older and even though longevity medicines and therapies are dramatically improving, the simple fact is most people will eventually need assistance. This means they need somebody to help them, and that’s a job.
The answer is higher productivity, namely AI and robotics. Anticipation of those is the main reason stocks are holding up. The problem is one of timing. The labor force is shrinking faster than productivity rises. That leads to both slower growth and higher prices.
That sounds a bit like 1970s-style “stagflation,” but with a twist. The 1970s saw high unemployment because the Baby Boom was reaching adulthood and more jobs were opening up to women. Labor supply was structurally high. Now labor supply is structurally weak, so we have a different dynamic. Continued inflation and moderate unemployment both seem likely even as GDP is flat or sluggish.
One element to this is confidence. Low unemployment doesn’t mean people are happy with their jobs or optimistic that their incomes will rise. This affects their behavior, which shows up in consumer spending and other ways. That part will get worse if AI breakthroughs destroy a bunch of human jobs before the economy creates new ones.
Like I said last week, this is a time we should all Prepare to Muddle Through.
Palace Intrigue
Before I go, I want to say a few words about changes at the Federal Reserve. Adriana Kugler, one of the seven Fed governors, resigned this month. Her term was set to end in January, so Trump was going to have a chance to fill that opening anyway. Now he has nominated Council of Economic Advisers (CEA) Chairman Stephen Miran to serve out Kugler’s remaining term. Trump said Miran will serve in the role until January 31, 2026, while he continues a search for a permanent replacement. The Senate will probably confirm his nomination quickly and before the September FOMC meeting. (h/t Ed Yardeni)
Jerome Powell’s term as chair will end in May. His term as a board member continues until 2028. He would traditionally resign from the board when his term at the chair ends but doesn’t have to. He could go against tradition and hang around, but I fully expect him to resign, write a book, and do lots of private speeches.
This will give Trump a second opening for a new chair. It is not clear at this time whether Miran wants to stay long-term at the Fed, go back to the CEA, or back into the private world. Stay tuned.
Trump could also pick a current governor as the new chair. That’s how Powell got the job—he had been a governor since 2012, then Trump promoted him to chair in 2018. But given Trump’s comments, it seems likely he will want his own person there.
As of now, the betting focuses on either Kevin Warsh, a former Fed governor (my clear-cut favorite), or Kevin Hassett who is currently one of Trump’s economic advisors. Current Fed governors Christopher Waller and Michelle Bowman are also possibilities. Both dissented from the last meeting’s vote against cutting rates, which should please Trump. But I still think he would prefer someone new.
Several weeks ago, I was present when Warsh spoke at an off-the-record meeting in Washington. He was very impressive. Without being too specific, I appreciated his views on Fed policy during his earlier tenure on the board. Suffice it to say he was not entirely aboard with QE and all the rest.
If you want a little more insight, I suggest reading a paper he wrote in 2009 called Defining Deviancy. Essentially, he takes a speech by Sen. Daniel Patrick Moynihan arguing that our culture was more accepting of what Moynihan said used to be called deviancy. Warsh said that the Federal Reserve in their use of QE and other nonconventional practices had normalized what was once considered taboo. It gives you a real insight into his philosophic approach and is one reason why I think he should be Fed chair.
14-Hour Travel Days, Newport Beach, and British Columbia
I have had many long airplane trips in my life. Shane and I once had to do three overnight flights from Buenos Aires to Dallas to London to Johannesburg which was basically 72 hours in airports and in the air. Lots of international flights. But one thing I really didn’t take into account when I moved to the paradise that is Puerto Rico is that a West Coast trip from San Juan is basically a 14-hour day. I fly to Newport Beach on Monday, have meetings and do videos all day Tuesday with David Bahnsen and meetings with clients of The Bahnsen Group, and then get up very early the next morning and fly back. Our fishing trip to British Columbia will have two 14-hour days there and back. I don’t like acknowledging getting older, but I will tell you that long flights do beat my body up more than they used to.
August might’ve been slower in my past life, but I am busier than ever this August. It is a good thing that I never wanted to retire, because I clearly haven’t. But I wouldn’t mind a little more leisurely lifestyle. It looks like I’m going to have to work to make that happen.
Like what you're reading?
Get this free newsletter in your inbox every Saturday! Read our privacy policy here.
And with that, I will hit the send button. You have a great week and enjoy being with friends.
|
Your taking all the data with a grain of salt analyst,

John Mauldin
P.S. If you like my letters, you'll love reading Over My Shoulder with serious economic analysis from my global network, at a surprisingly affordable price. Click here to learn more.
Put Mauldin Economics to work in your portfolio. Your financial journey is unique, and so are your needs. That's why we suggest the following options to suit your preferences:
-
John’s curated thoughts: John Mauldin and editor Patrick Watson share the best research notes and reports of the week, along with a summary of key takeaways. In a world awash with information, John and Patrick help you find the most important insights of the week, from our network of economists and analysts. Read by over 7,500 members. See the full details here.
-
Income investing: Grow your income portfolio with our dividend investing research service, Yield Shark. Dividend analyst Kelly Green guides readers to income investments with clear suggestions and a portfolio of steady dividend payers. Click here to learn more about Yield Shark.
-
Invest in longevity: Transformative Age delivers proven ways to extend your healthy lifespan, and helps you invest in the world’s most cutting-edge health and biotech companies. See more here.
-
Macro investing: Our flagship investment research service is led by Mauldin Economics partner Ed D’Agostino. His thematic approach to investing gives you a portfolio that will benefit from the economy’s most exciting trends—before they are well known. Go here to learn more about Macro Advantage.
Read important disclosures here.
YOUR USE OF THESE MATERIALS IS SUBJECT TO THE TERMS OF THESE DISCLOSURES.
Tags
Did someone forward this article to you?
Click here to get Thoughts from the Frontline in your inbox every Saturday.