Bull’s Eye Investing (Almost) Ten Years Later
-
 John Mauldin
- |
- June 30, 2012
- |
- Comments
- |
- View PDF
Bull’s Eye Investing (Almost) Ten Years Later
Reliving the Past Nine Years
Are We There Yet?
High P/E, Low Returns
Tuscany, Italian Football, and Two German Losses
It's been almost a decade since I co-authored with Ed Easterling of Crestmont Research some research in this letter that later became chapters five and six of Bull's Eye Investing. Although the ten-year anniversary of the book is actually 2013, the current vulnerabilities in the markets encouraged us to revisit the material a bit early, to prepare you for what lies ahead. Reflecting back to yesteryear gives us the opportunity to assess the accuracy of our insights.
I am in Tuscany at the moment, watching the sun set over the Tuscan hills; so I will thank Ed for doing the heavy lifting in this letter while I get to relax, although there is so much going on and I am such a junkie that I am forced to get my current-events fix every day. I must say, the news certainly provides some very pure adrenaline rushes. But more on that at the end. For now we take the longer view of the stock market that I first wrote about at the end of the last century, and to which Ed added some real meat in early 2003.
But first, I am pleased to be able to announce the release of the rest of the videos of the 2012 Strategic Investment Conference, co-sponsored by my partner, Altegris, which we held last month. David Rosenberg (and many attendees!) said this was the best conference ever, featuring a world-class lineup of economic and financial leaders. Our very enthusiastic attendees created a roomful of energy that the speakers seemed to feed off of, and everyone brought their "A" game. It really was quite special. And now we have the videos.
Those of you who are members of my special program for accredited investors, called the Mauldin Circle, can access the conference videos by going to the "My Information" section at the bottom of your personal home page, when you log into www.altegris.com. I can't think of a better way to sharpen your investment outlook than to partake of the insights of some of the best minds in the world, including Dr. Lacy Hunt, Niall Ferguson, David Rosenberg, Jeffrey Gundlach, Mohamed El-Erian ... not to mention your humble analyst.
In order to view the videos, you must be a member of the Mauldin Circle. This program has replaced our Accredited Investor Newsletter Program. My partner Altegris and I have worked hard to enhance the program, which now includes access to webinars, conferences, special events, videos, accredited newsletters, and presentations featuring alternative-investment managers and other thought leaders and influencers.
The good news is that this program is completely free. The only restriction is that, because of securities regulations, you have to register and be vetted by one of my trusted partners, which in the United States is Altegris, before you can be added to the subscriber roster. This will be a quite painless process (I promise). Once you register, an Altegris representative will call you to provide access to the videos, presentations, and summaries from the speakers featured at our 2012 Strategic Investment Conference.
Click here to initiate your membership in our exclusive Mauldin Experience Program. After you have talked with the Altegris representative, you'll be able to view the first set of five videos, featuring Dr. Lacy Hunt, Jeffrey Gundlach, Niall Ferguson, David Rosenberg, and Mohamed El-Erian, as well as the final set featuring Dr. Brock, our two all-star panels (one with Marc Faber), and yours truly. I think you will find the presentations particularly relevant this week. And now, let's think about secular bear markets.
Bull's Eye Investing (Almost) Ten Years Later
Our discussion of a coming secular bear market almost ten years ago was not hypothetical forecasting, but rather it was a discussion about the fundamental factors that drive stock market returns. Even though it is challenging to predict the market over months and quarters or even a few years, we believe the data shows that the stock market is quite predictable over some longer periods. Those periods are the secular stock market cycles of above-average bulls and below-average bears.
In the opening paragraphs of chapter five, in bold emphasis, we wrote:
We will make the case that it is more useful to analyze stocks during secular bear markets in terms of value than in terms of price... These cycles generally take a generation to work their way through the investor public, have significant magnitudes of becoming undervalued and overvalued, and have significant implications for the way that investors should approach each of these periods.
We emphasized that:
Further, we show that volatility and frequent large rallies are the norm and not the exception, thus giving the astute investor some terrific opportunities. Finally, we will make a connection between inflation, interest rates, and stocks that will give us further indications of the direction of the stock and bond market in the coming decade.
If the cycles of the past century continue to repeat, most of the first decade (or more) of this century will experience a secular bear market – an extended period of generally down or sideways and choppy stock market conditions....
These periods in the past have been the result of market valuation cycles represented by the P/E ratio. The valuation cycles have resulted from generally longer-term trends in inflation toward or away from price stability. The short-term, somewhat random, market gyrations are the result of then-current circumstances and market forces wrestling stock prices around a gravity line of the broader cyclical trend.
What did P/E do over the past decade and where is it today? What does it tell us about the future? What new insights can we glean by adding nine years of history to some of the charts and graphs in the original chapters? In addition to chart updates, there are quite a few new charts here from Crestmont Research. Well, there is a lot to review as we look back over the past decade, with an eye on the next decade.
Reliving the Past Nine Years
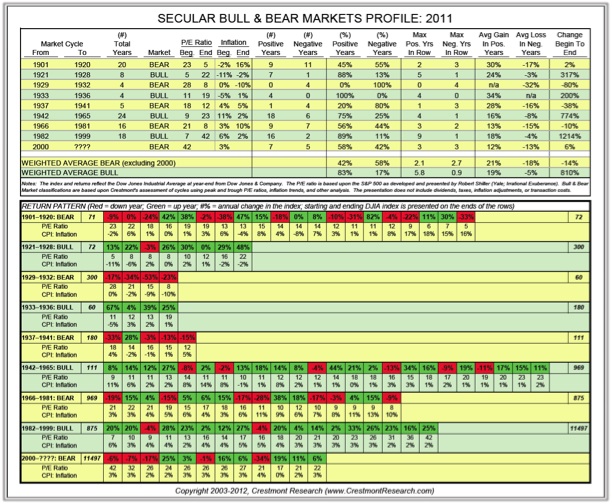
For a good overview of the past nine years and this secular bear market, here's an update to Table 5.6 in Bull's Eye Investing. When we wrote the chapters in 2003, the charts and graphs were current through year-end 2002. At the time, P/E was a lofty 26 –though it had come down significantly from bubble levels in the 40s. To reduce the distortions to P/E caused by the earnings cycle, earnings (E) were normalized using the approach popularized by Robert Shiller at Yale (which uses earnings over a ten-year period). The resulting P/E is often called the cyclically adjusted P/E, or P/E 10.
http://www.crestmontresearch.com/docs/Stock-Secular-Chart.pdf
There are several points to emphasize in the chart above. This secular bear (so far!) has been relatively calm compared to historical secular bears. The typical bear has more negative years than positive years (only 42% positive), yet this cycle so far has had more positive years (58% positive). The gain and loss years have been more muted, with gains and losses averaging around two-thirds of normal levels.
Certainly this secular bear has not been calm as we have experienced it in real time, but the relative calmness compared to past cycles may be an indicator of what lies ahead before the bear retires.
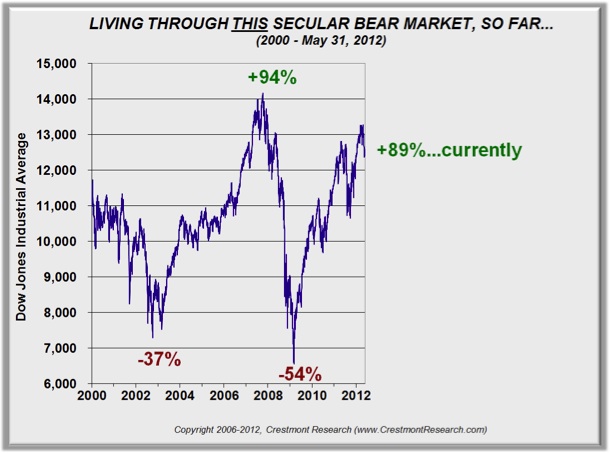
Some investors certainly do think the current secular bear has been extreme. Here's what it has brought us so far:
http://www.crestmontresearch.com/docs/Stock-This-Secular-Bear.pdf
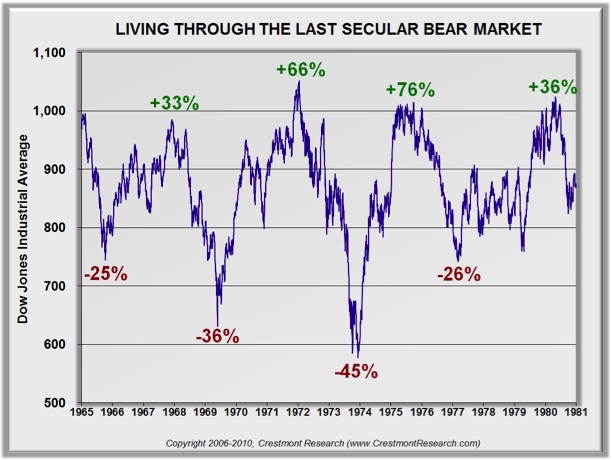
The pattern and process have not been very different from what we expected in 2003. As we wrote in Bull's Eye Investing, "... volatility and frequent large rallies are the norm and not the exception" in secular bear markets. Here's the previous secular bear (1966-1981) as an example. Yes, the 54% decline by 2009 was greater than the 45% in 1974, but the pattern of numerous short-term surges and falls had again repeated.
There is another approach to assessing volatility that was included in Bull's Eye Investing. Table 5.1 revealed that the stock market is much more volatile than most people realize. Rather than use confusing and boring statistics, we took more of a layman's approach. We highlighted that the market moves up or down more than 10% annually in almost 70% of the years. It moves more than 16% in either direction in half of all years. So what has happened so far in the present cycle?
Like what you're reading?
Get this free newsletter in your inbox every Saturday! Read our privacy policy here.
Crestmont has updated that volatility analysis through 2011, and it now reveals new insights by breaking out separate details for bulls and bears. It is striking that overall volatility is relatively similar for secular bulls and bears. Note the frequency inside the 10% and 16% ranges. In both secular bulls and bears, nearly 30% and 50% of the years fall inside the respective ranges. The difference is that bulls predominantly have upside years, while bears have more downside years.
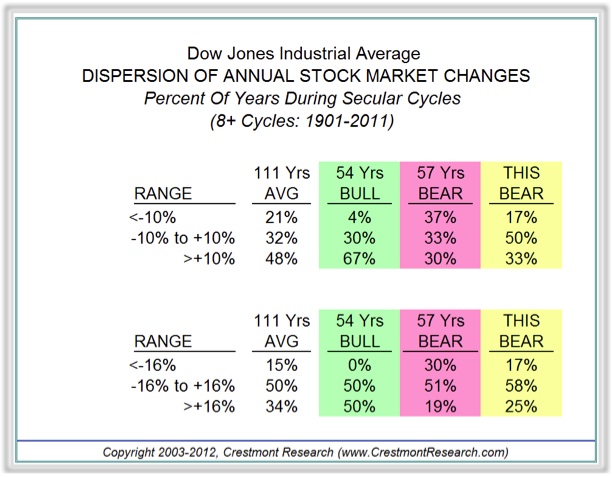
The results so far for this secular bear have been a bit different. First, there have been more inside years – another indication that the first part of this secular bear has been a bit tamer than usual. Second, notwithstanding the crisis plunge into 2009, the downside years have been under-represented. Why?
So far, this secular bear has not made much progress through the fundamental process that a secular bear must undergo. As we highlighted in Bull's Eye Investing, "The valuation cycles have resulted from generally longer-term trends in inflation toward or away from price stability." Other than an occasional flirt with deflation or inflation over the past decade, we're stayed relatively close to price stability. There are certainly lots of pressures building for deflation and inflation, either of which would drive this secular bear to its den. But for now, the choppiness has us in a bit of a holding pattern. The stock market's gyrations and underlying earnings growth over the past nine years have driven P/E from the mid-twenties to the low twenties, but the market has yet to experience the full process of valuation declines in the face of an adverse inflation rate trending into deflation or high inflation.
Are We There Yet?
Here are two new charts from Crestmont Research that explain how we got here and just how much farther we have to go. The charts reflect the normalized P/E ratio for the S&P 500 Index for all secular bull and secular bear cycles since 1900. The lines on the charts show the price/earnings ratio (P/E) over the life of each secular cycle.
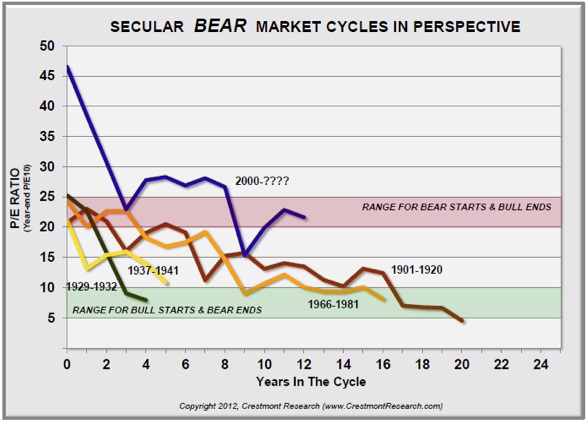
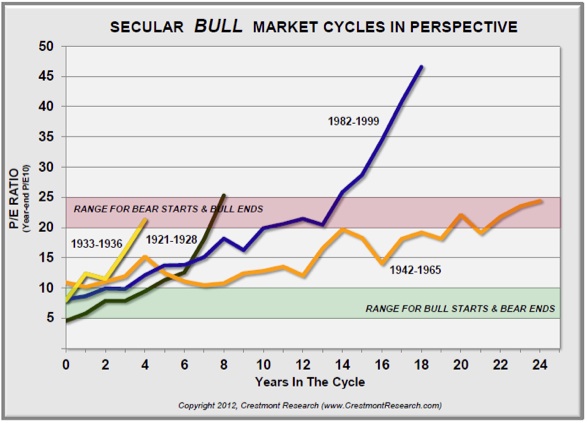
First, note that secular bulls start when P/E is low and end when P/E is high. Similarly, secular bears start when P/E is high and end when P/E is low. In the charts, the low range is designated with green shading and the typical high range is shaded red.
Look at the secular bull of the 1980s and 1990s. It is as though that secular bull ran its course through the mid-1990s, then P/E more than doubled again. The already high P/E ascended to the bubblesphere.
Compare the two graphs. Every secular bear cycle prior to our current one followed a secular bull that ended with P/E in or near the red zone. That set the starting point for every subsequent secular bear. But this time, the super secular bull of the late 1990s ended nearly twice as high – it was a major bubble. The past twelve years saw the bubble popped and P/E restored to levels typically associated with a low inflation rate. It has taken more than a decade to wear away the effects of the late 1990s extremes.
The current valuation of the stock market is relatively high, but it is not overvalued, considering today's conditions. Low inflation-rate conditions should be accompanied by relatively high P/Es. But if deflation or high inflation (or both) are likely upcoming, the market is very expensive. On the other hand, if the inflation rate happens to remain near price stability, then this secular bear could remain active a while longer – but how likely is that?
High P/E, Low Returns
In Bull's Eye Investing we explained that high market valuations (P/E) necessarily drive low long-term returns. This occurs because periods that start with high P/Es often end with lower P/Es, eating away at returns. Further, high-P/E periods have low dividend yields. As a result, we could write with confidence nine years ago that subsequent returns would be well below average.
In all cases, throughout the years, the level of returns correlates very highly to the trend in the market's P/E ratio. The P/E ratio is the measure of valuation as reflected by the relationship between the prices paid per share to the earnings per share (EPS). Higher returns are associated with periods during which the P/E ratio increased and lower or negative returns resulted from periods during which the P/E ratio declined.
This may be the single most important investment insight you will get from this book. When P/E ratios are rising, the saying that a "rising tide lifts all boats" has been historically true. When P/Es are dropping, stock market investing is tricky; index investing is an experiment in futility. As we will see in later chapters, in these secular bear market periods, successful stock market investing requires a far different (and sometimes opposite) set of skills and techniques than what is required in bull markets....
Given the current and recent level of P/Es, the prospects are not encouraging for general market gains (the emphasis is on general or index funds) over the next two decades. This dismal outlook is not from some congenital bear perspective; it corresponds to the series of factors driving the current secular bear market.
Although P/E has declined over the past nine years, from 26 to near 20 (using the Shiller method), stock market valuation remains relatively high. Almost everything in chapters five and six of Bull's Eye Investing remains true today. The market has chopped around with fairly typical volatility. P/E is in the lower end of the red zone rather than above it. Most importantly, currently high valuations portend low returns from here.
Like what you're reading?
Get this free newsletter in your inbox every Saturday! Read our privacy policy here.
How low? That depends upon the outlook for deflation or higher inflation.
Our crystal balls are showing us different things on that question, although our fundamental conclusions are the same. Ed sees moderate probabilities for either higher inflation or deflation. On his optimistic side, he even allows for the prospect of continued price stability for quite some time. John, however, sees flashing danger signs of upcoming deflationary pulses, to be followed later by higher inflation. He outlined his reasoning in Endgame.
So, together, we have several scenarios. We have some side bets as to who will be right; but more importantly for you, none of the outcomes deliver good overall equity market returns, because we are still at a relatively high P/E.
Next week we will return to a few more paragraphs from Bull's Eye Investing, and then we will explore the implications of the entire analysis.
By the way, Ed has written a must-read book on the likely outcomes of the stock market over this decade. It enables the reader to see the impacts of key factors on their outlook. Probable Outcomes is packed with details and extensive full-color charts and graphs. Here's a link to it at Amazon: www.amazon.com/Probable Outcomes.
And John has condensed Bull's Eye Investing to a version for Wiley called The Little Book of Bull's Eye Investing, in which he focuses on the basics of secular cycles and absolute-return investing. The book is just out, and you can get it at your local bookstore or at www.amazon.com/Little Book of Bull's Eye Investing.
(For the record, Ed is the author of Probable Outcomes: Secular Stock Market Insights and the award-winning Unexpected Returns: Understanding Secular Stock Market Cycles. He is President of Crestmont Research, an investment management and research firm, and a Senior Fellow with the Alternative Investment Center at SMU's Cox School of Business, where he previously served on the adjunct faculty and taught the course on alternative investments and hedge funds for MBA students. He publishes provocative research and graphical analyses on the financial markets at www.CrestmontResearch.com, one of my favorite websites.)
Tuscany, Italian Football, and Two German Losses
I am in Tuscany tonight, in a little town called Trequanda, staying in the same villa as on previous trips. It is an idyllic location, with each trip providing ever more delights upon which to feast my eyes and soul. This is the third year I have come back to Tuscany and the first time since I was a kid that I have been to the same spot even twice on vacations. This is truly a special place.
This year I have a number of friends coming to stay for a time, helping to create an ever-growing and always interesting collage of ideas and anecdotes. The conversations have been inspirational and thought-provoking. And perhaps it helps that the news has been so, well, entertaining and such food for discussion. More on the guests and our conversations next week, but for now I will close with couple of notes.
On Sunday night we wandered over to the next little village of some 400 souls, called Montisi. We had dinner in the town square, where we watched, with half the town, Italy play England in the Eurocup soccer quarterfinals. I watched the growing tension as the two teams played to a tie and then went into two overtime periods, which ended with the score still even.
This necessitated a "shoot-out," which is a man-on-man match between one player trying to get the ball past the goalie. He is close enough that it requires both players to commit to a strategy before the action – at this high level of soccer there is no time to change once you commit. It is a total mind game, and one that requires skill and experience.
There were five alternating attempts, with the crowd cheering and groaning with each shift of the momentum tide. And then all of a sudden, with a block here and a miss there (including a marvelous soft "dink" shot by an Italian, totally catching the English goalie by surprise), Italy had drawn ahead. The level of emotion was profoundly moving to me. As an American, I can only relate it to the US-Russian Olympic hockey game in 1980, when a young, overmatched US team took down the Russian juggernaut.
And then Thursday night we watched Italy take on Germany in the semifinals. Germany was a 2-1 favorite, although one of my dinner guests offered 4-1 odds, which found a few takers. Given that I know so little about soccer and that betting against a 2-1 favorite on a one-time bet seemed a tad rash, I demurred but offered to hold the wagers.
I should have taken the plunge. Somehow, Italy stepped up and simply outplayed the Germans. And amusingly, as I was watching the game in Europe, the US markets were still trading; and this morning David Zervos sent me this note: "... as I was watching Italy vs Germany yesterday something very odd happened just as Balotelli scored his second goal. At that moment, when it became clear that the Germans were going to lose, the [S&P 500] shot up from 1308 to 1323. It then occurred to me, when Germany loses, spoos [the trader term for the S&P 500 index] win!"
And then Germany seemingly lost again today, as Italian Prime Minister Monti (and Spanish PM Rajoy) simply refused to allow any resolution at all to pass at the summit until Merkel agreed that the eurozone must jointly back Spanish banks without Spain having to guarantee the debt. And while there must have been relief in Madrid, there was also joy in Dublin, as the Irish are now in line for a similar deal, which will cost at least €64 billion. Of course, with Germany's agreement, every taxpayer in Europe is now on the hook, and not just in Germany. But it was a necessary condition if a fiscal union is to be formed and the eurozone is somehow to be salvaged.
Perhaps Monti took courage from his football team, but he certainly got Merkel to back down. By my count, that is Merkel at 0-2 in recent contests. Interestingly, I was in Madrid on Saturday with good friend Alberto Dubois, who invited about ten of his friends to join us. Quite the group of very serious Spanish businesspeople in the room, mostly C-level and chairman types. After the usual questions and conversation about my views on the world, I turned the tables and started interviewing them.
Like what you're reading?
Get this free newsletter in your inbox every Saturday! Read our privacy policy here.
I may write some more about what happened, but two items leapt out. They unanimously and emphatically agreed that Spain would do whatever it takes to remain in the eurozone. A breakup of the eurozone was simply not something they could contemplate. "It would be a total disaster for Spain," said one, and everyone nodded.
"But what if Germany decided to leave on their own, as the price of staying was going to be too high?" I asked. Again, they were adamant that Germany would not leave and a fiscal union would be worked out. Perhaps this was a self-selected group of friends, but I was struck by the passion with which they argued that the euro would survive. They simply could not imagine a breakup.
I was not convinced they were right, but I left with a few things to ponder. And then today, Merkel backed down. And the markets leaped for joy on the news, even though the very thorny details have to be worked out. Germany loses, the market rises. How long can this trend last?
It is time to hit the send button. It is now quite late and as I wrap up I still feel the glow of six hours of fascinating conversation that postponed the completion of this missive. Oddly, I find I have been able to resist the powerful pull of the marvelous Italian wines that have been set on tables here and there this week, but the real temptation was cheap Italian Prosecco during the day. Go figure.
Have a great week. On Monday we will take in the famous Palio horse race in the square in Siena, along with some 250,000 people crowded into a very small place. Quite the tradition, going back to the mid-1600s. Fortunately, we have a balcony or two from which to watch. But enough. Have a great week! I certainly will.
Your wondering why I am not here for at least a month analyst,

John Mauldin
P.S. If you like my letters, you'll love reading Over My Shoulder with serious economic analysis from my global network, at a surprisingly affordable price. Click here to learn more.
Put Mauldin Economics to work in your portfolio. Your financial journey is unique, and so are your needs. That's why we suggest the following options to suit your preferences:
-
John’s curated thoughts: John Mauldin and editor Patrick Watson share the best research notes and reports of the week, along with a summary of key takeaways. In a world awash with information, John and Patrick help you find the most important insights of the week, from our network of economists and analysts. Read by over 7,500 members. See the full details here.
-
Income investing: Grow your income portfolio with our dividend investing research service, Yield Shark. Dividend analyst Kelly Green guides readers to income investments with clear suggestions and a portfolio of steady dividend payers. Click here to learn more about Yield Shark.
-
Invest in longevity: Transformative Age delivers proven ways to extend your healthy lifespan, and helps you invest in the world’s most cutting-edge health and biotech companies. See more here.
-
Macro investing: Our flagship investment research service is led by Mauldin Economics partner Ed D’Agostino. His thematic approach to investing gives you a portfolio that will benefit from the economy’s most exciting trends—before they are well known. Go here to learn more about Macro Advantage.
Read important disclosures here.
YOUR USE OF THESE MATERIALS IS SUBJECT TO THE TERMS OF THESE DISCLOSURES.
Tags
Did someone forward this article to you?
Click here to get Thoughts from the Frontline in your inbox every Saturday.

 John Mauldin
